Heap Status Graphical Report
Use this screen to explore how your program is using memory. Selecting an option tells MemoryScape which category of memory it should display. Many developers begin with this report as its graphical representation simplifies exploring how a program uses memory. Later, developers move to other reports as they try to refine what they are seeing.
As this illustration shows, MemoryScape can display a pop-up window when you place your cursor over a block.
After you select a block, MemoryScape fills in information in the bottom part of the window. In addition, you can click the Backtrace/Source tab to see the place in your program that allocated the block.
When you select a block in the chart or select information in the tabbed areas, MemoryScape highlights related information. For example, when you click on a block, MemoryScape highlights all blocks having the same backtrace.
For more information, see “Task 7: Graphically Reporting the Heap.”
Move your cursor over the graphic to obtain help.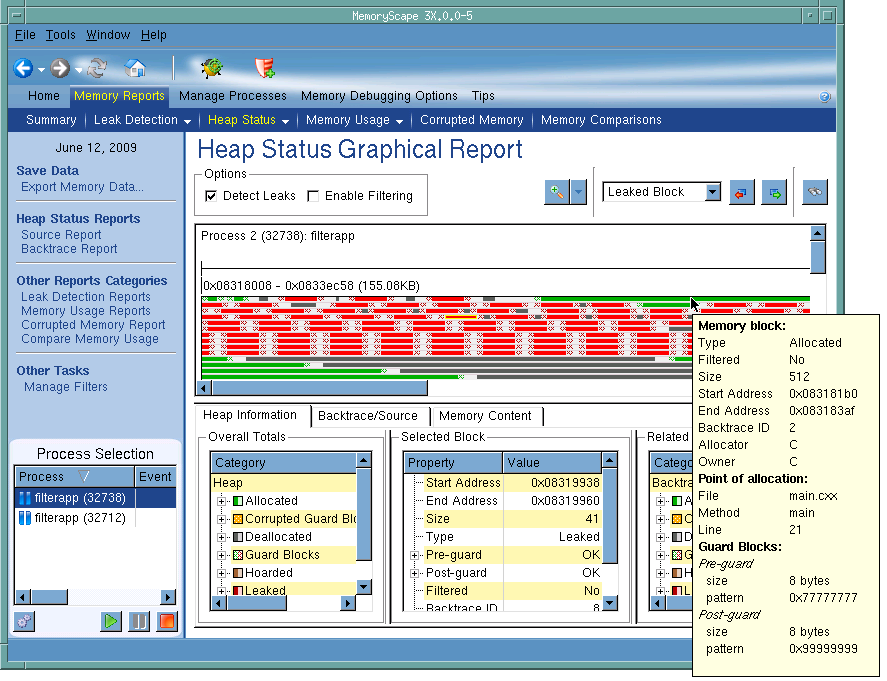
Options
Click a check box to tell MemoryScape to show leaked memory within the graph and if it should apply your filter to this display.
After selecting Detect Leaks, MemoryScape analyzes memory and your program. This analysis consists of looking for memory blocks that your program’s variables do not reference. It it finds unreferenced blocks, it displays them in red.
After selecting Enable Filtering, MemoryScape applies your filter against the heap. It displays all filtered blocks in gray. In other words, in contrast to other reports where filtered blocks are not included, this report just changes the way it displays them. It displays them in this way so that memory isn’t displayed with holes in it.
Zoom controls
The zoom controls let you change how much information is being displayed. If you select the arrow, MemoryScape displays four items that let you zoom in or out, reset the report, or fit the display to the window.
Find controls
The find controls let you search for different kinds of memory. Clicking on the arrow displays a four item list from which you can select Leaked Block, Corrupted Block, Heap Region,or Related Block. Next, click on either the curved arrows to find either the previous or next block of the indicated type.
Find block by address
Clicking on this button tells MemoryScape to display a dialog box into which you can type a memory address. After entering that address, MemoryScape displays the block within its central display area.
Graphical display area
The graphical display area is the heart of this report. Each block within the graph indicates one memory allocation. These allocations are displayed in color. (The key to the way they are colored is contained within the left bottom Overall Totals area.) When you place your cursor over a block, it displays a pop-up window containing information about it. This is the same information that appears in the center bottom Selected Block area. In addition, the bottom right area contains information about related blocks when you click on the block in the center area.
As you scroll around this area, you will often notice that there may be areas in which there are no blocks. This is quite typical and simply represents the way in which your operating system’s heap manager allocates memory.
Heap Information tab
Contains three areas: Overall Totals, Selected Block, and Related Blocks.
Overall Totals: Contains summary information about the way your program is using heap memory as well as a key to the graph’s color coding. As this area is quite small, you cannot see all the information contained here until you resize the area. The fields in this area are Category, Bytes, and Count.
Selected Block: Displays a variety of information about the selected block. The contents of this area depend upon the memory debugging options you have selected.
Related Blocks: Contains information about related blocks. Related blocks are blocks that have the same backtrace ID. As this area is quite small, you cannot see all the information contained here until you resize the area. The fields in this area are Category, Bytes, and Count.
Backtrace/Source tab
Clicking on this tab displays the following two areas:
Backtrace area: Contains the backtrace associated with the block that you select in the central graph. A backtrace is the call stack that existed when your program allocated the memory block. The source area shows the line in your program associated with the selected function.
Source area: Shows the line in your program associated with the information shown in the backtrace area. When you click on a function in the backtrace area, the information in this area changes.
Memory content
Selecting this tab displays the raw contents of memory.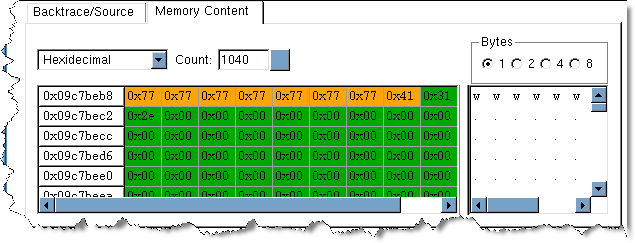
Popup
After you place your cursor over a block, MemoryScape displays information about the block. This information is also displayed within the Selected Block area.
Process selection
Contains a list of processes and files added to this memory debugging session.
Execution controls
These controls let you refresh or create ( ) this report, run (
 ), or halt (
 ) your program.
), or halt () your program.Debug in TotalView
Tells MemoryScape to open the currently selected process in TotalView. The TotalView process window will display the current state of that process. You must have a TotalView license available to debug in TotalView.
Be aware that opening the TotalView process window from within MemoryScape does not initialize TotalView in the same way as starting TotalView directly. The definitions in your .tvdrc file and your saved breakpoints are not loaded. However, you can load a breakpoint file using the Action Point menu item in the process window. If you need the definitions in your .tvdrc file, start TotalView first and open MemoryScape from within TotalView.
Red Zones
Tells MemoryScape to set the Red Zones option on or off for the selected processes.
For information on the Memory content tab, see “Task 11: Viewing Corrupted Memory.”


