Debug Options
You can choose to enable various additional debugging features for a given session. Select the Debug Options tab to launch options.
Depending on the type of debug session, different options are available:
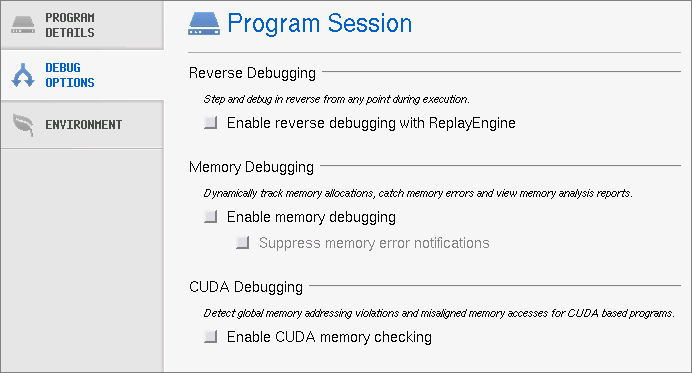
These two windows’ options include Reverse Debugging, Memory Debugging, and CUDA Debugging.
 |
The Attach to a running program window includes Reverse Debugging and a special Attach Option.
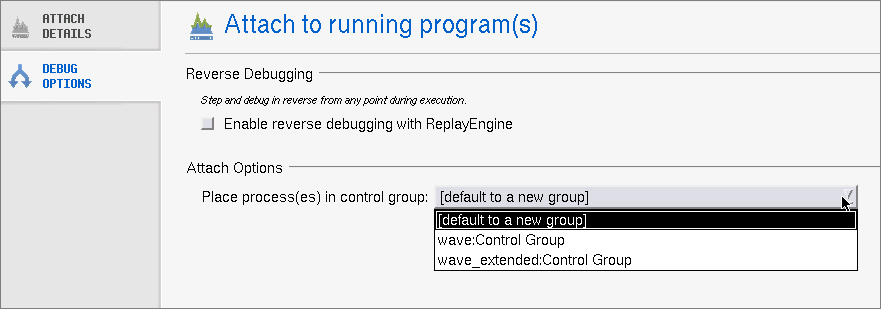 |
The Enable ReplayEngine check box is visible only on Linux-x86-64 platforms. If you do not have a license for ReplayEngine, enabling the check box has no effect, and TotalView displays an error message when your program begins executing. Selecting this check box tells TotalView that it should instrument your code so that you can move back to previously executed lines.
Enabling memory debugging here is the same as enabling it within MemoryScape or using the Process Window’s Debug> Enable Memory Debugging command.
The Enable memory debugging and Suppress memory error notifications check boxes perform the same functions as the Enable memory debugging and On memory event, halt execution checkboxes do within the Advanced Options on MemoryScape’s Memory Debugging Options page. This is the equivalent of the basic Low setting.


