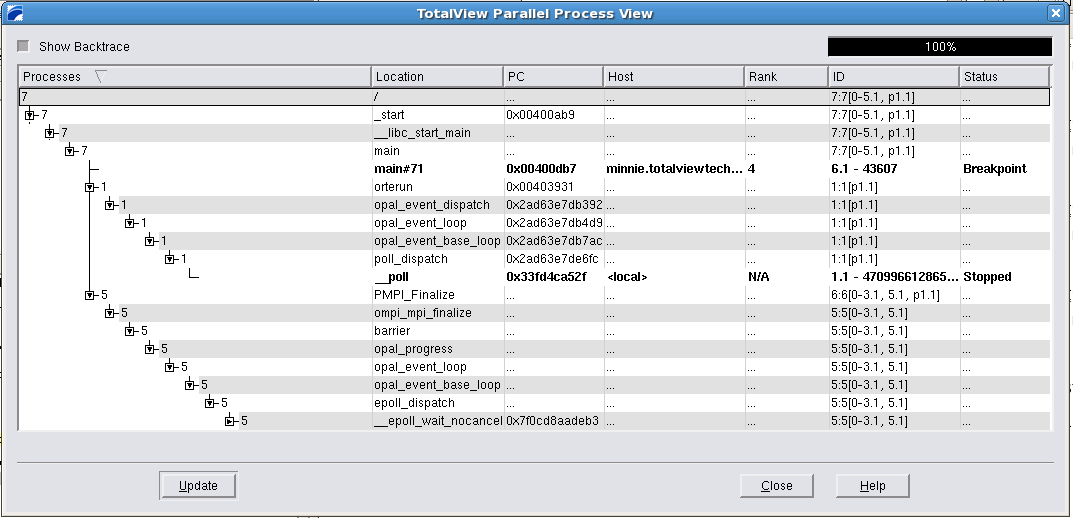
The Parallel Backtrace View
The Parallel Backtrace View displays the state of every process and thread in a parallel job, allowing you to view thousands of processes at once, and helping you to identify stray processes.
Access the Parallel Backtrace View from the Tools menu of the Variable Window.
This view groups threads by common stack backtrace frames in a text-based tree. Expand or collapse elements to drill down and get more information.

