Viewing Options
The Visualizer shows either a Graph view (2-D plot) or Surface view (3-D plot) of your data. (If the array is one-dimensional, only the Graph view is available. The Graph view is not discussed here.)
By default, it shows a Surface view for most two-dimensional data, and that is what it shows for the waves array.
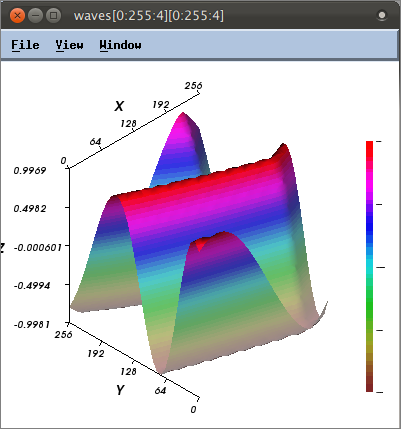
The Surface view displays two-dimensional datasets as a surface in two or three dimensions. The dataset’s array indices map to the first two dimensions (X and Y axes) of the display, and the values map to the height (Z axis).
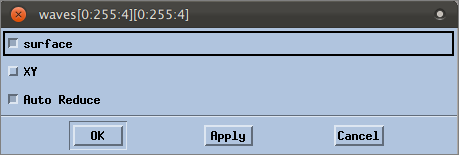
You can further refine the Surface view using the View window’s options. Select File > Options from the View window to launch the Options dialog.
Possible options are:
• surface: Displays the array as a three-dimensional surface (the default is to display it as a grid).
• XY: Reorients the view’s XY axes. The Z axis is perpendicular to the display.
• Auto Reduce: Speeds visualization by averaging neighboring elements in the original dataset.
For example, click surface, then click OK. The view changes from a grid to a 3-D:
The Visualizer has many more options with various other viewing modes and tools. See the Related Topics below for references to further discussions.
This completes this tutorial on basic debugging.


