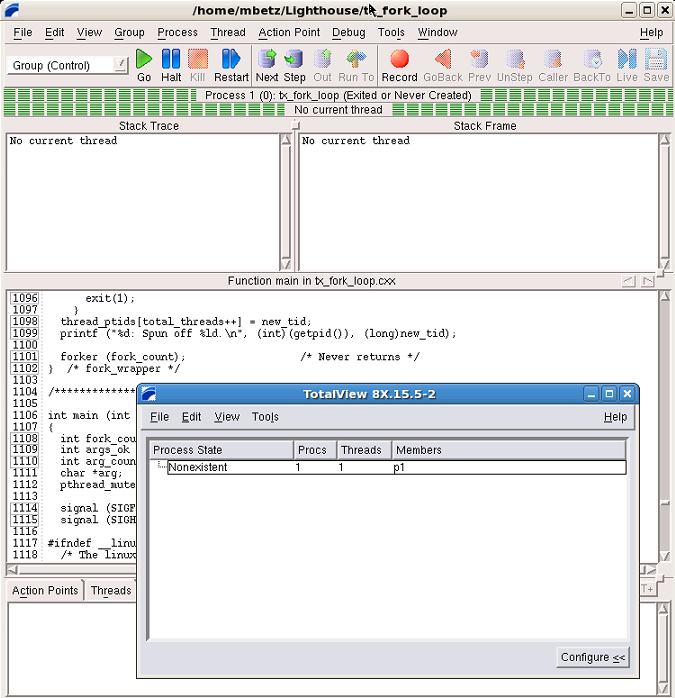
The Root and Process Windows
At startup, TotalView launches its two primary windows, the Root Window and the Process Window. With these two windows, you can navigate through the various elements of your program.
The Root Window
The Root Window (the smaller window above) lists all processes and threads under TotalView control. You can use the Configure pane, displayed by clicking the button on the bottom right, to specify the specific information you want to view.
Since the program has been created but not yet executed, there is just a single process and thread listed.
The Process Window
The Process Window displays a wide range of information about the state of a process and its individual threads.
• The Stack Trace pane displays the call stack with any active threads.
• The Stack Frame pane displays information on the current thread’s variables.
• The Source Pane displays source code for the main() function. Note that the pane’s header reports its focus as being in main():
• Two tabs are visible at the bottom, Action Points, which displays any set action points, and Threads, which lists all active threads in the process. The Processes/Ranks tab, if enabled, displays processes within the current control group. The Processes/Ranks tab is disabled by default.

