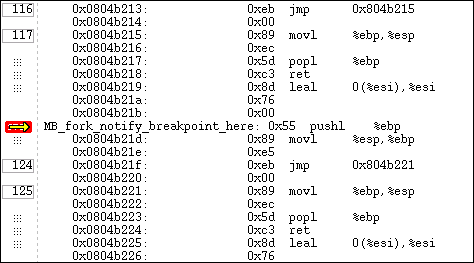
To set a machine-level breakpoint, you must first display assembler code. You can now select an instruction. TotalView replaces some line numbers with a dotted box ( )—this indicates the line is the beginning of a machine instruction. If a line has a line number, this is the line number that appears in the Source Pane. Since instruction sets on some platforms support variable-length instructions, you might see a different number of lines associated with a single line contained in the dotted box. The
  icon appears, indicating that the breakpoint occurs before the instruction executes.

