Debugging a New Program
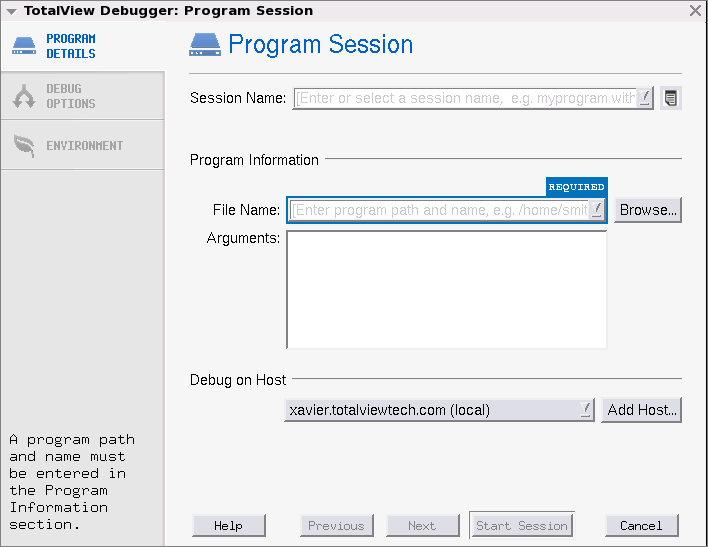
To configure a new debugging session, either:

Select
A new program to launch the Program Session dialog, or
The Program Session dialog launches.
1 Enter a session name in the Session Name text box.
2 Enter the name of your program in the File Name box or press Browse to browse to and select the file. You can enter a full or relative path name. If you have previously entered programs here, they will appear in a drop-down list.
If you enter a file name, TotalView searches for it in the list of directories named using the
File > Search Path command or listed in your
PATH environment variable.
3 (Optional) Add any custom configurations or options:
 Remote debugging
: Select or add a remote host, if the program is to be executed on a remote computer. See
“Adding a Remote Host”.
 Program arguments
: Enter any program arguments into the Arguments field.
Because you are loading the program from within TotalView, you will not have entered the command-line arguments that the program needs. For detail, see
Program Arguments in the In-Product Help.
4 Click Start Session. The Start Session button is enabled once all required information is entered.
