The Parallel Program Session Dialog
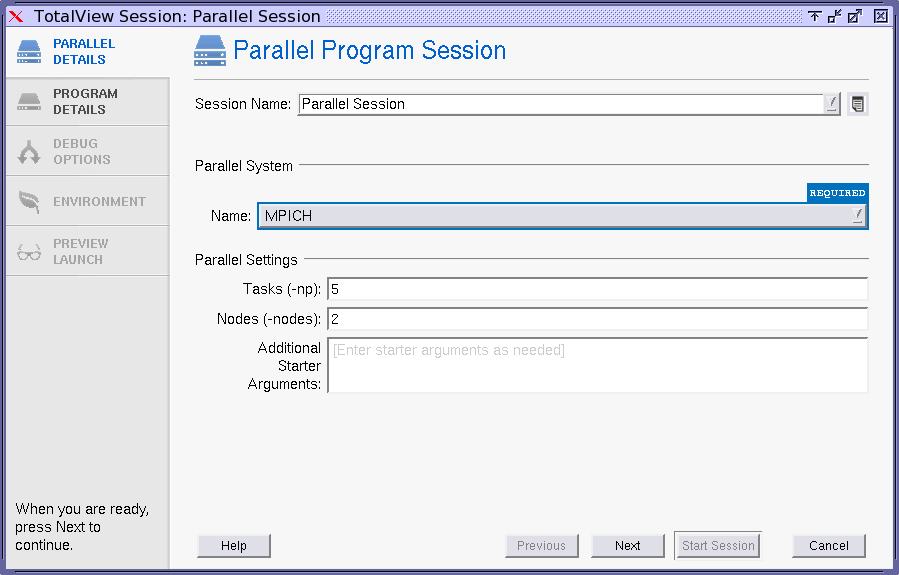
1 Enter a session name in the Session Name field.
2 Select the Parallel system, the number of Tasks, and Nodes.
3 (Optional) Enter any additional arguments required by the starter process into the Arguments area. Note that these arguments are those sent to a starter process such as mpirun or poe. They are not arguments sent to your program.
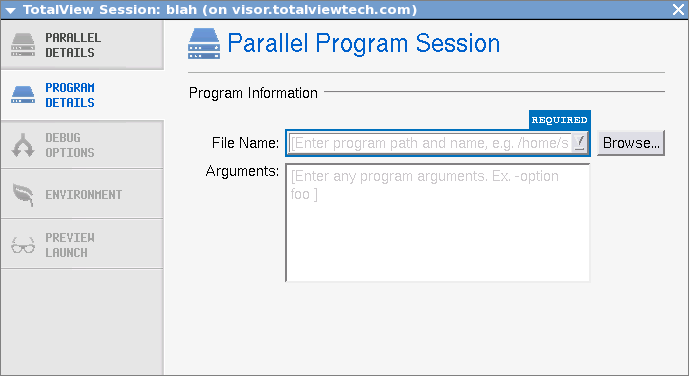
4 Select the Program Details tab to enter the file name of the program being debugged and any arguments to be sent to your program.
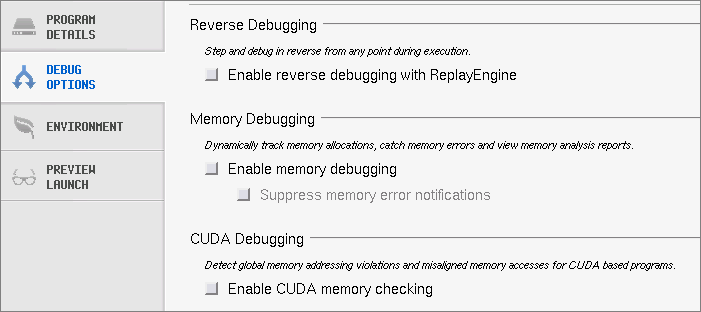
5 Select any optional settings:

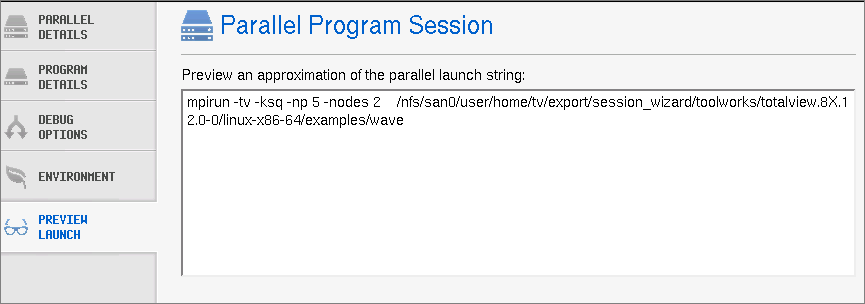
Select the
Preview Launch tab to view the launch string TotalView will use to open your debugging session.
6 Select the Start Session button to launch the TotalView.
Once created, a session named my_foo can be quickly launched later using the -load command line option, like so:
totalview -load_session my_foo
