Launching the Visualizer from an Eval Point
1 Add an eval point

Click on line 63 at the function
wave() to add a breakpoint, as the comments suggest.

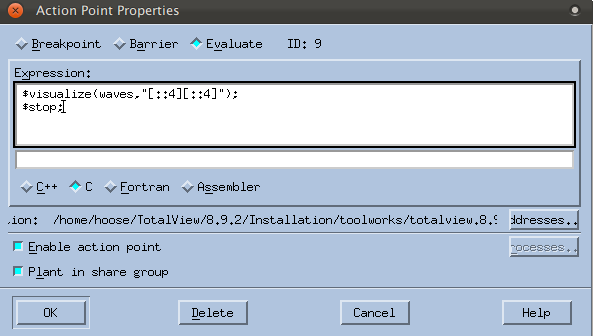
Right-click on the breakpoint icon and select Properties to launch the
Action Point Properties dialog.

Click the
Evaluate button to open the Expression field. Enter the following code:
$visualize(waves,"[::4][::4]");
$stop;
When the eval point is hit, this code will launch a single Visualizer window that will display every fourth element in the major dimension (the X axis), and then program execution will stop. To display the entire array, you could just write:
$visualize(waves); // entire array
(Note that the code comments suggest launching two Visualizer windows. For purposes of this discussion, we’ll add just one.)

Click
OK. The Eval Point icon appears:
2 Run the program and view the data
At this point, the program should have no regular breakpoints and two eval points:

Click
Go.
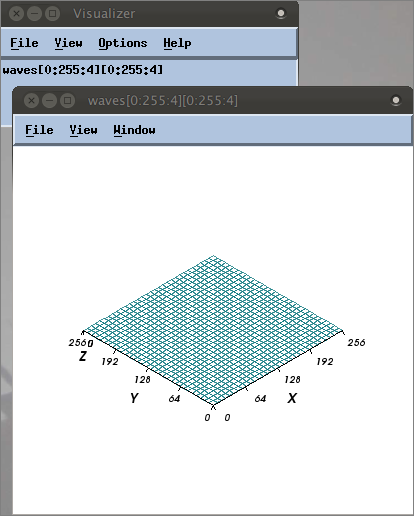
The program runs to the eval point at wave() and then stops. The Visualizer launches, reflecting the array’s initial values:
Above are the Visualizer’s two windows: the top window is the Dataset window listing all datasets available to visualize (only one dataset has been loaded into the Visualizer at this point); the bottom is the View window where the graphical display appears.
3 Complete the program

Click
Go several more times (the program will complete once you have clicked
Go as many times as the value for the variable
count in the eval point).
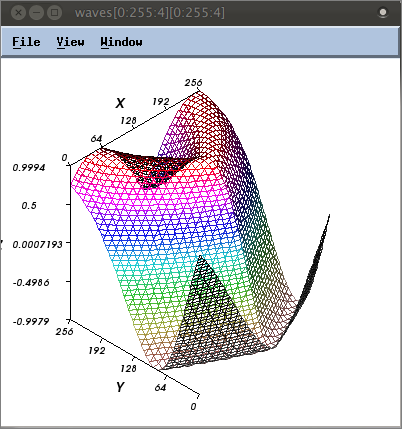
You can watch the wave build, for example:
4 Run the program without stopping execution
An eval point does not have to stop execution. To let the program run without interruption, just remove the $stop command from the Expression field in the Action Point Properties dialog, then click Go.


