Examining Program State and History
After enabling ReplayEngine, you can begin controlling your program’s execution using the same execution commands you use when ReplayEngine is not enabled. For example, you might set a breakpoint and press the Go button or select a line and press the Run To button.
When you wish to view the program’s state, halt your program, then use the GoBack, Prev, UnStep, Caller, or BackTo buttons to go to the statement you wish to examine. These four buttons are similar to the Next, Step, Out, and Run To tool bar buttons, differing only in that the Replay buttons go backwards in the program’s history. The Debug pull-down menu contains the menu bar equivalents to these commands.
While you are in replay mode, notice that the Next, Step, Out, and Run To tool bar buttons are still displayed to move forward in the history.
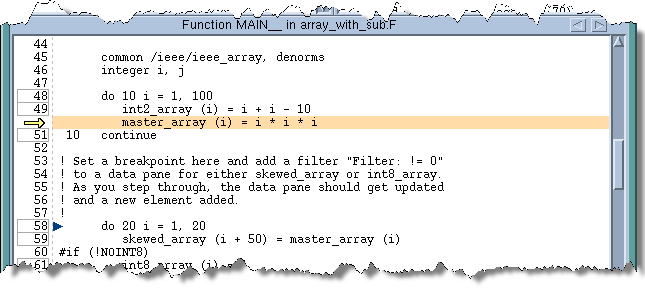
When you’re in replay mode, TotalView changes the highlight line from yellow to orange within the Source Pane.
The Process window always shows the last line executed within record mode using the

symbol and the yellow highlight line is on the same line as this symbol. When you are in replay mode, this symbol is where ReplayEngine shifts from replay mode to record mode.
The scoping commands at the far left side of the tool bar have no effect in replay mode as the ReplayEngine only supports process width.

