Attach to a Running Program
Use this screen to attach to a running program. While the process of attaching to a process within MemoryScape is quite simple—just select the process and click a button—MemoryScape cannot obtain memory debugging information from that file unless you either:

Link in the Heap Interposition Agent (HIA) into the program before the program began executing. This is discussed in the “Debugging Memory Problems Using MemoryScape” book.
Set a preload environment variable before launching the program. The preload variables are:
Platform | Variable |
Apple Mac OS X | DYLD_INSERT_LIBRARIES |
IBM AIX | MALLOCTYPE |
Linux | LD_PRELOAD |
Sun | LD_PRELOAD |
IBM Blue Gene/P and Blue Gene/Q | LD_PRELOAD |
The best way to set this variable is by using the env command. For example, here’s how you would set this variable on a Linux system:
env LD_PRELOAD=user:tvheap_mr.a my_prog
Click on an area in the graphic to obtain help.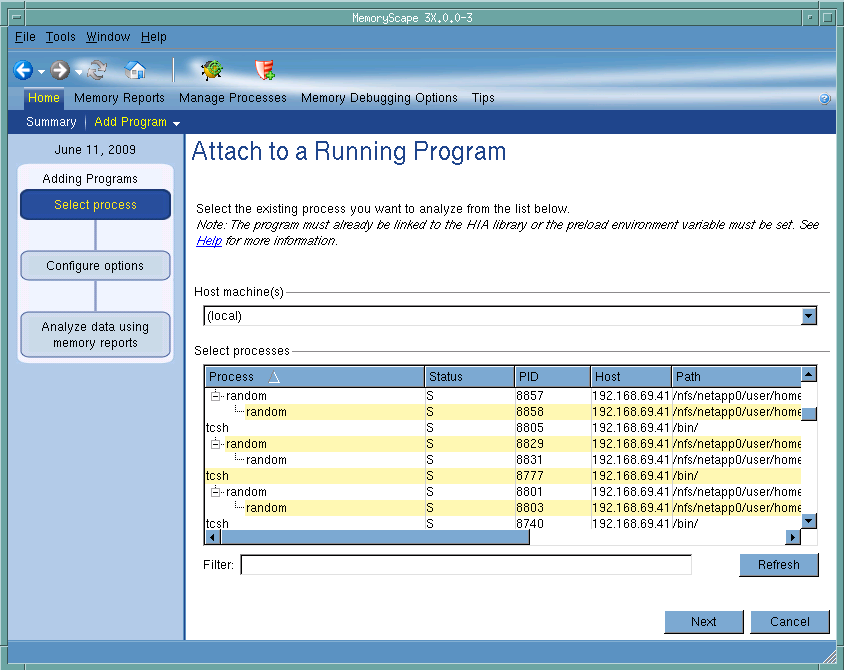
Host machines
You can either type the name of the machine upon which your program will execute or select a previously named machine from the dropdown list. The machine entered within this area must have the same architecture as the machine upon which you are running MemoryScape, with the exception of those heterogeneous platforms described in
Heterogeneous and Cross-Debugging on Linux, in the
TotalView Platforms Guide. For example, if you are running MemoryScape on a linux-x86 machine, you cannot name a Sun Solaris system.
Select processes
After selecting a host, MemoryScape displays all of the processes running on that host. You will then select the process to which MemoryScape will attach.
Adding Programs
This chart shows how many steps are involved in attaching to a file and where you are in this process.
Filter
If too many processes are displayed, you can remove some from this list by using a filter that specifies a pattern for the files that MemoryScape will display. Type the filter using normal shell globbing rules; that is, you can use such characters as asterisks (*) and question marks (?) as wildcard characters. For example, you could type “fo*b?r”.
After entering a filter, click the Refresh button to apply the filter against the displayed list of processes.
Debug in TotalView
Tells MemoryScape to open the currently selected process in TotalView. The TotalView process window will display the current state of that process. You must have a TotalView license available to debug in TotalView.
Be aware that opening the TotalView process window from within MemoryScape does not initialize TotalView in the same way as starting TotalView directly. The definitions in your .tvdrc file and your saved breakpoints are not loaded. However, you can load a breakpoint file using the Action Point menu item in the process window. If you need the definitions in your .tvdrc file, start TotalView first and open MemoryScape from within TotalView.
Red Zones
Tells MemoryScape to set the Red Zones option on or off for the selected processes.