When your program uses functions in the malloc library, MemoryScape intercepts them, recording the action you have requested. If you enable guard blocks—this done by selecting Medium within the Memory Options screen—the MemoryScape agent will also write small blocks of information before and after all blocks that your program allocates. These blocks are called guard blocks. The guard block preceding the allocated block is initialized to one value (by default, this value is 0x77777777). The guard block following the allocated block is initialized to a second value (by default, this value is 0x99999999). Because they are different, MemoryScape can determine which block was the source of the problem.
If your program writes data into either of the guard blocks, it changes this pattern. MemoryScape can detect this change in two ways:
|
|
When your program deallocates a memory block, MemoryScape checks the guard block. If your program altered a guard block, MemoryScape stops execution and notifies you about the data corruption. (Task 6: “Using Runtime Events”.)
|
|
|
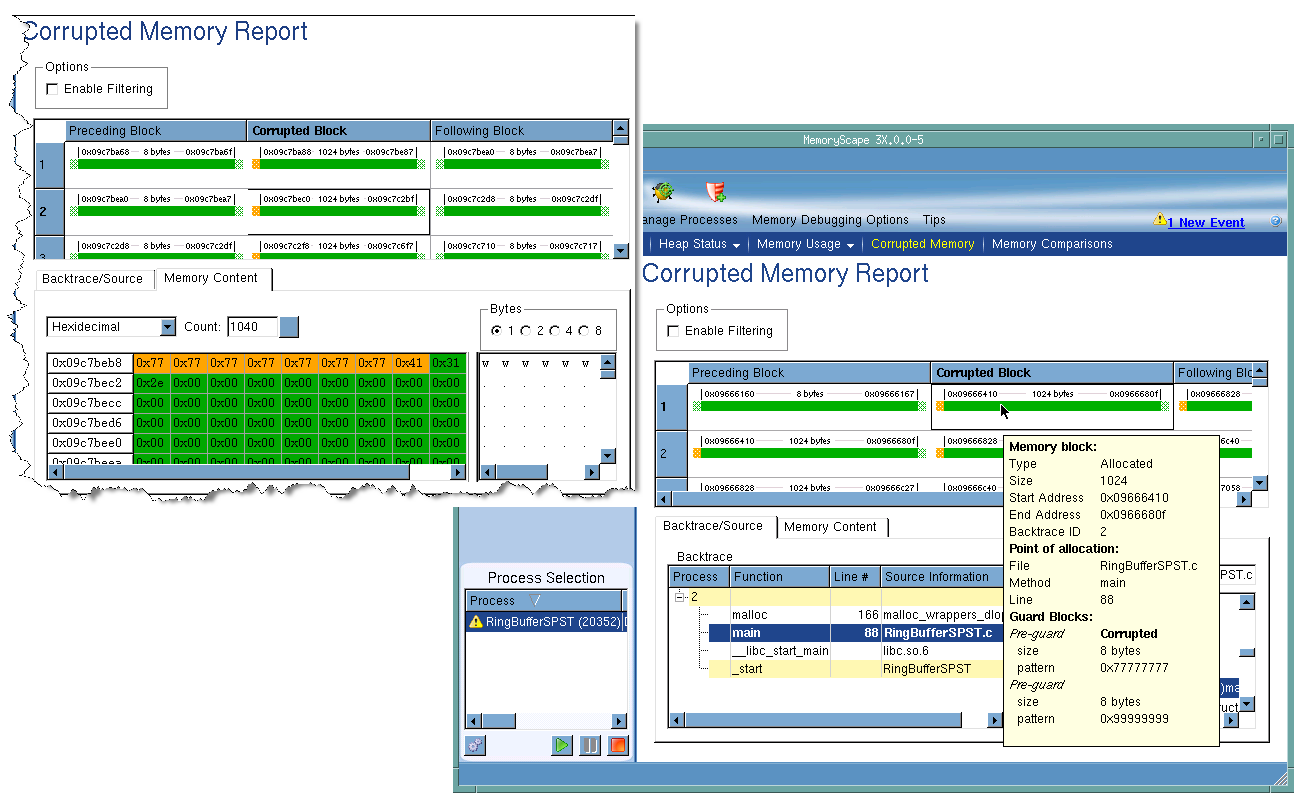
You can halt execution (see Task 4: “Controlling Program Execution”) and display the Memory Reports | Corrupted Memory screen. This tells MemoryScape to examine all guard blocks and check for changes. If any are found, it displays a report similar to that shown on the right side of Figure 69.
|
|
Figure 69: Corrupted Memory
|
The Corrupted Memory report contains two sections: a top section graphically displaying each corruption, and a bottom section containing a backtrace and the allocation source line for the allocated block. This is the same kind of information that is displayed in other reports. For information on these reports, see Task 8: “Obtaining Detailed Heap Information”.
If you place your cursor over a block, MemoryScape displays additional information about the block. In addition, if you right-click on a block and select Properties from the context menu, MemoryScape displays its Block Properties window. This window contains all the information that appears in the pop-up display and it may contain additional information. For information on using the Block Properties window, see Task 6: “Using Runtime Events”.
