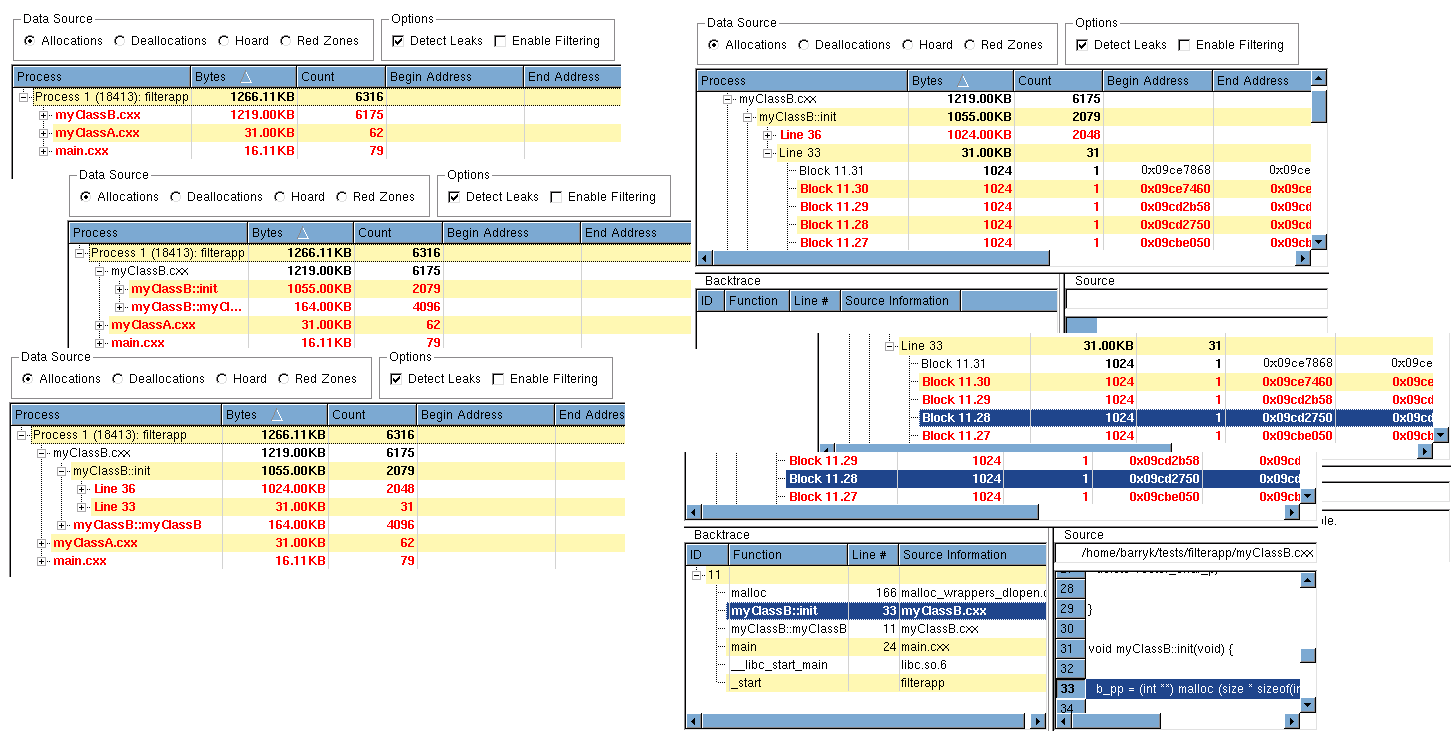
The Source report contains three scrolling areas as well as a top control area. The Data Source controls tell MemoryScape which information to display. Your choices are allocations, deallocations, or the hoard. In most cases, you’ll want to see allocations. MemoryScape does not let you combine these kinds of information into one report.
By default, MemoryScape does not show leaks. If you want to see them, select the Detect Leaks check box. If you have created a filter, apply it to the display by using the Enable Filtering check box. (For information on filtering, see Task 10: “Filtering Reports”.)
The top area organizes information by your program’s source files. The Bytes column contains the amount of memory associated with a line in each file. As you can sort the columns, you might want to sort the information by this Bytes column. If you are displaying leaks, this lets you focus on the leaks that waste the most memory. That is, why focus on a leak that is under 1K when there’s a 10M leak?
By repeatedly clicking, you’ll soon get to the line in your program from which memory was allocated. The information in this line shows each block allocated from this line and the backtrace ID associated with it.
There is a distinction between backtraces associated with the statement and the statement in your program that allocates memory. Suppose you have a function called create_list(). This function could be called from many different places in your code. When MemoryScape creates backtraces, each has a different backtrace. For example, if create_list() is called from eight different places and each was called five times, there would be eight different backtraces (and eight different backtrace IDs) associated with it. Each individual backtrace would have five items associated with it.
As you click on lines in the top portion, the bottom right area shows lines from your source code. The line mentioned in the top area is highlighted here, Figure 64.
|
Figure 64: Uncovering Information
|
When you need to see the backtrace, just click on the backtrace ID in the bottom left area. As you select different levels in the stack in the backtrace, MemoryScape changes what it displays in the source area.
