Debugging Multi-process and Multi-threaded Programs
When your program creates processes and threads, TotalView can automatically bring them under its control. If the processes are already running, TotalView can acquire them as well. In this way, you don’t need to run multiple debuggers.
The processes that your program creates can be local or remote; both are presented in the same way. You can display them in the current Process Window or in an additional window.
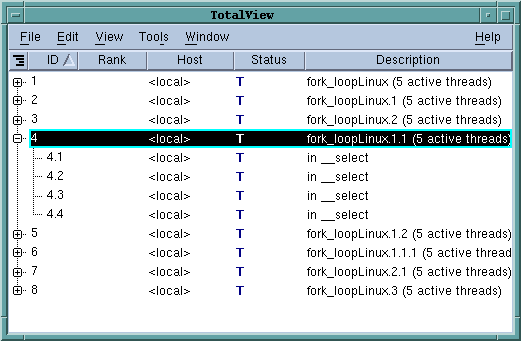
The Root Window, which appears along with the Process Window after you start TotalView, contains an overview of all processes and threads being debugged. Diving on a process or a thread listed in the Root Window takes you quickly to the information you want to see.
|
|
|
|
Select a process from the list and press OK. You can then debug these processes in the same way as any other process or thread.
|
|
|
From the Processes tab, click on a box representing a process. For each click, TotalView switches contexts. Similarly, clicking on a thread in the Threads tab changes the context to that thread.
|

