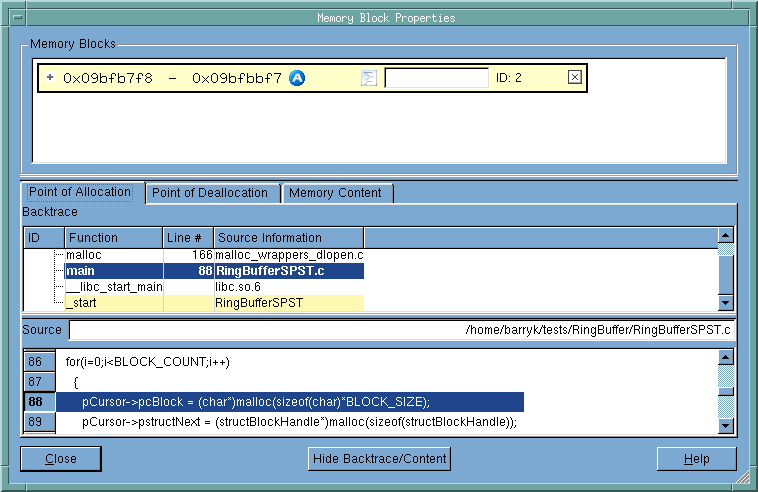
In many places within MemoryScape, you can right click on a displayed block and select Properties, which launches the Memory Block Properties dialog, Figure 28.
|
Figure 28: Memory Block Properties
|
Contains a list of all memory blocks for which you have requested property information. Notice the + symbol. When selected, MemoryScape displays more information about the block. Click on parts of the third picture in this help topic for information.
When selected, MemoryScape displays information it has collected about the memory block at the time when it was allocated. Click over other areas in this picture for information.
When selected, MemoryScape displays information it has collected about the memory block at the time when it was deallocated. If this tab is empty, the block has not yet been deallocated. The nformation displayed in this area is the same as the Point of Allocation tab.
When selected, MemoryScape displays information about the bytes contained within the block. Click on parts of the second picture in this help topic for information.
Contains the backtrace associated with the block. (A backtrace is the call stack that existed when your program allocated the memory block.) Clicking on a function in this area changes the display in the Source area.
The Source area shows the line in your program associated with the selected function and the file containing this line of code.
Hides the bottom part of this window so that only the Memory Blocks area is visible.
