|
|
Improvements to the way TotalView launches MPI programs let you use TotalView with virtually every MPI library, even with those that were not configured for debugging.
|
|
|
TotalView now highlights changes to values displayed in the Variable and Expression List windows with a colored background.
|
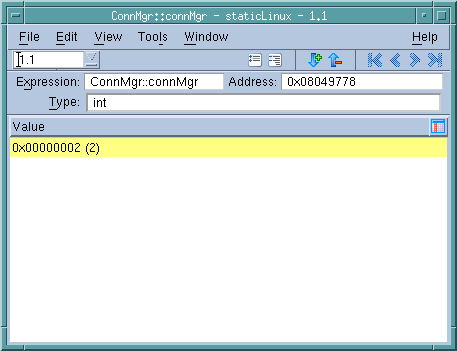 |
While this figure shows a simple variable, TotalView also highlights changed elements within compound variables such as structures and arrays.
|
|
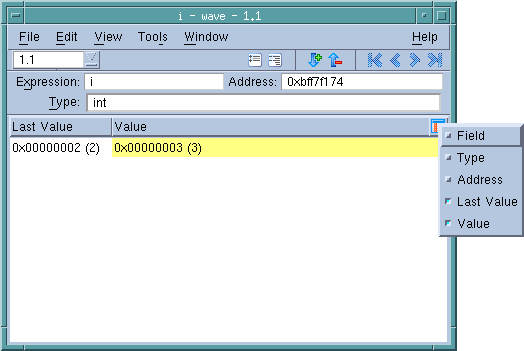
Values in the Variable and Expression List windows have a Previous value hidden column that you can display. Use the control on the right side of the column headings to display a list of columns that you can display or hide.
|
 |
|
|
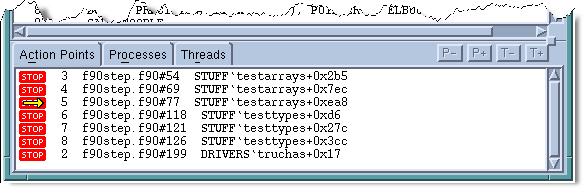
When a process hits a breakpoint, TotalView highlights the breakpoint by placing an arrow over the breakpoint ID in the Action Points pane.
|
 |
|
|
View > Show Across replaces View > Laminate in the Variable window's menus. This means the commands you will now use are View > Show Across > Process and View > Show Across > Thread.
|
|
|
You can now tell TotalView to show a variable across processes or threads by right-clicking on it in the Source Pane, then selecting either Across Processes or Across Threads from the context menu.
|
|
|
The Create Watchpoint command was added to the Action Points menu. As always, you can create a watchpoint from within the Variable window by selecting Tools > Create Watchpoint.
|
|
|
You can now set a watchpoint upon a variable’s memory address by right-clicking on the variable in the Source pane and then selecting Create Watchpoint from the context menu.
|
|
|
You can completely expand or collapse information in the Variable window by selecting an icon in the toolbar. The accelerators for these commands are Ctrl++ (that’s the control key and the + symbol) and Ctrl+- (which is the control key and the - symbol).
|
|
|
You can specify more than one core file on the command line and you can use wildcards in core file names.
|
 |
|
|
Within the Memory Debugger’s File > Import Data dialog box, you can select multiple memory debugging (.mdbg) files.
|