The following commands are on the File pulldown:
File > Dataset
Raises the Dataset Window to the front of the desktop. If the Dataset Window is minimized, it is restored.
File > Options
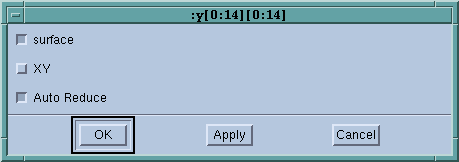
Displays a dialog box containing viewing options. Here is what you’ll see if you are displaying a Graph View:
If this option is set, the Visualizer displays the array’s data as a three dimensional surface. If you don’t set this option, the Visualizer displays the surface in two dimensions.
If this option is set, the Visualizer derives the displayed surface by averaging over neighboring elements in the original dataset. This speeds up visualization by reducing the resolution of the surface. Clear this option if you want to accurately visualize all dataset elements.
The Auto Reduce option lets you choose between viewing all your data points—which takes longer to appear in the display—or viewing the averaging of data over a number of nearby points.
Deletes the View Window’s dataset from the dataset list. This also destroys any other View Windows viewing the dataset.
Window > New Base Window
Creates a new View Window using the same visualization method and dataset as the current View Window.

