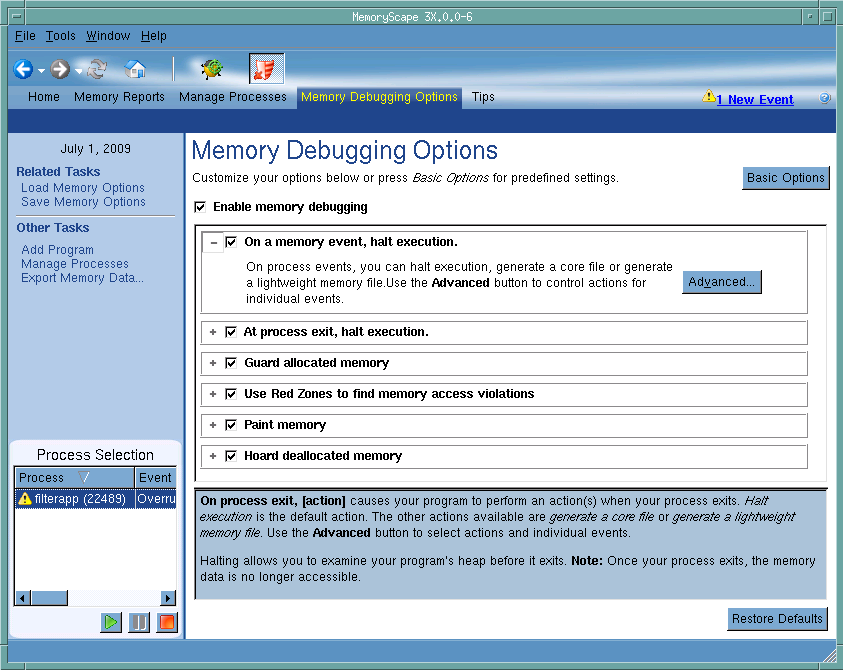
Use this screen to alter memory debugging properties. The information here that describes these advanced options is brief. For detailed information, see “Task 3: Setting MemoryScape Options”.
Contains a list of processes and files added to this memory debugging session. The changes you make to MemoryScape options are only applied to the processes that you select. By default, all processes are selected.
When enabled, tells MemoryScape to stop execution before your program exits. At this time, all memory information that MemoryScape has collected can be examined. If you let the process exit, MemoryScape releases this information and it can no longer be analyzed.
When enabled, MemoryScape halts execution if a memory event—for example, you’ve asked MemoryScape to notify you when a block is deallocated—or error—for example, a double free problem—occurs.
When enabled, MemoryScape writes several bytes of information both before and after an allocated block. These extra bytes are called guard blocks. If MemoryScape finds that your program overwrites a guard block, it can tell you about this problem.
When enabled, MemoryScape protects your allocated blocks with an extra page of memory, called a Red Zone. You can protect the beginning of your allocation or the end or both. Be aware that Red Zones increase your memory consumption. If MemoryScape finds that you read or write in the Red Zone, it will raise an event to alert you to the violation. To conserve memory usage, use the Red Zone button on the task bar as needed for suspect allocations. Red Zone controls appear on the toolbar only on platforms that support Red Zone capabilities. See the Platform Guide for specific platform support.
When enabled, MemoryScape initializes allocated and deallocated memory with a bit pattern. If your program sees these patterns, it can recognize that a problem has occurred.
When enabled, MemoryScape does not let your program’s deallocation requests surrender memory back to your program’s heap manager. Instead, it is held onto (this is called hoarding) for a time. In this way, data written into a hoarded block retains the correct information. This allows your program to continue running a bit longer. This can help you identify some types of problems. It is especially useful in helping you locate shared memory problems.
Tells MemoryScape to open the currently selected process in TotalView. The TotalView process window will display the current state of that process. You must have a TotalView license available to debug in TotalView.
Be aware that opening the TotalView process window from within MemoryScape does not initialize TotalView in the same way as starting TotalView directly. The definitions in your .tvdrc file and your saved breakpoints are not loaded. However, you can load a breakpoint file using the Action Point menu item in the process window. If you need the definitions in your .tvdrc file, start TotalView first and open MemoryScape from within TotalView.
