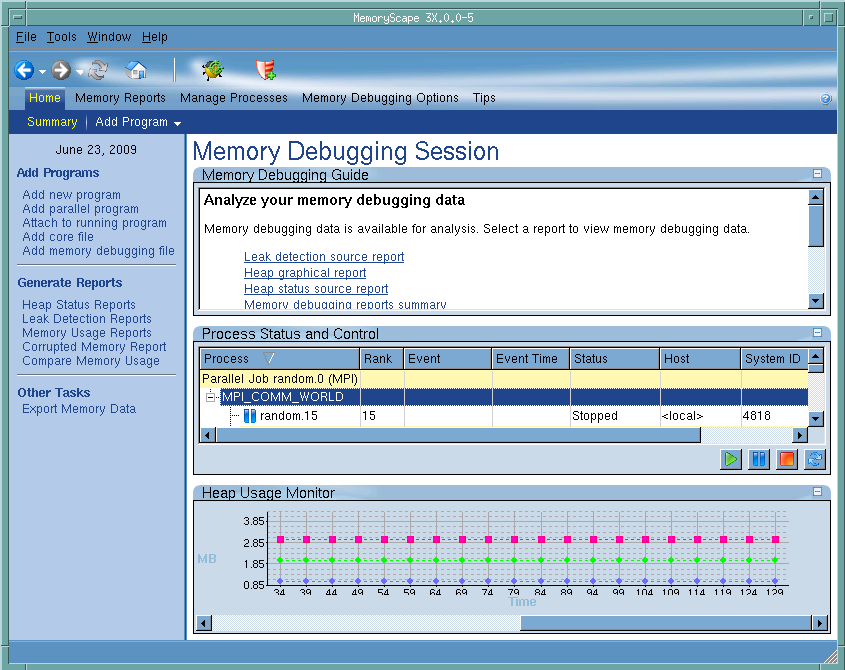
Use this screen to monitor and control process execution. For more control, use the controls within the Manage Processes and Files screen.
Contains some of the actions that you can now perform. The actions that you can perform here depend upon the actions that MemoryScape is performing and process execution status.
Contains a list of all your processes. The symbol to the left of the file name indicates its run status. The execution controls beneath the list let you start and stop execution of all of these programs.
Shows how much heap memory your processes are using. The monitor is turned off by default. You can turn it on or off using the button in the lower left corner of the section. Typically, MemoryScape updates this display every five seconds. (Select the File > Preferences command to change this interval.) Watching this monitor can sometimes indicate that your program is using excessive memory or, if you understand how your program is supposed to be using memory, you can identify when things are not going as expected. In either case, you can halt execution and then obtain reports that help you identify the problem.
Tells MemoryScape to open the currently selected process in TotalView. The TotalView process window will display the current state of that process. You must have a TotalView license available to debug in TotalView.
Be aware that opening the TotalView process window from within MemoryScape does not initialize TotalView in the same way as starting TotalView directly. The definitions in your .tvdrc file and your saved breakpoints are not loaded. However, you can load a breakpoint file using the Action Point menu item in the process window. If you need the definitions in your .tvdrc file, start TotalView first and open MemoryScape from within TotalView.
