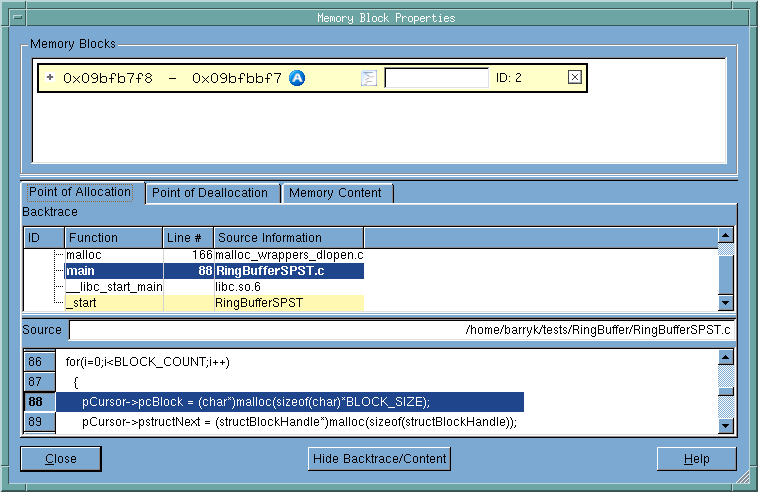
In many places within MemoryScape, you can right click on a displayed block and select Properties. MemoryScape responds by displaying the following window.
Contains a list of all memory blocks for which you have requested property information. Notice the + symbol. When selected, MemoryScape displays more information about the block. Click on parts of the third picture in this help topic for information.
When selected, MemoryScape displays information it has collected about the memory block at the time when it was allocated. Click over others areas in this picture for information.
When selected, MemoryScape displays information it has collected about the memory block at the time when it was deallocated. If this tab is empty, the block has not yet been deallocated. The kinds of information displayed in this area are the same as are displayed when you select the Point of Allocation tab.
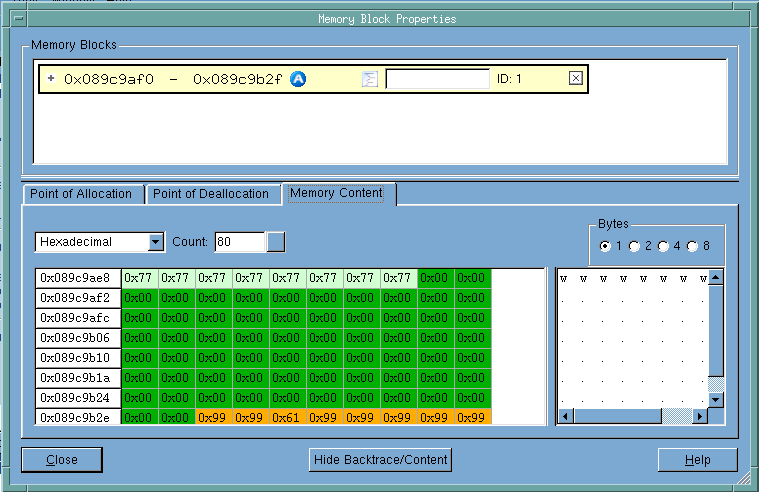
When selected, MemoryScape displays information about the bytes contained within the block. Click on parts of the second picture in this help topic for information.
Contains the backtrace associated with the block. (A backtrace is the call stack that existed when your program allocated the memory block.) Clicking on a function in this area changes what is displayed in the Source area.
The Source area shows the line in your program associated with the selected function and the file containing this line of code.
When you click the Memory Contents tab, MemoryScape displays the contents of this memory block. It does this in a manner similar to that used in the shell od command.
Contains a list of all memory blocks for which you have requested property information. Notice the + symbol. When selected, MemoryScape displays more information about the block. Click on parts of the third picture in this help topic for information.
Tells MemoryScape to display information in one of the following ways: Hexadecimal, Decimal, Unsigned Decimal, Octal, Character, Float, Binary, or Address. How many characters and the size of the blocks are set using the Count and Bytes controls.
The left column names the first memory address being displayed in the remaining columns in the row. The colors used to display blocks indicates their status, as follows:

If the contents of a memory address can be interpreted as a character, it is displayed in this area.
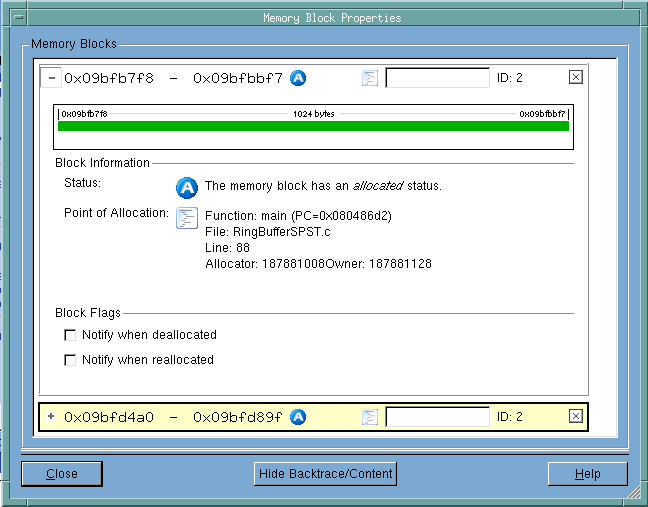
If you expand the top area of the Block Properties window manually or if you click the Hide Backtrace/Content button, you can see additional information about the memory block.
Lists the starting and ending address of each block, its status— means allocated. As this window contains an entry for each block for which you’ve requested properties, more than one block can be displayed, as is shown here.
Shows a display of the blocks similar to how it is shown in the Heap Status Graphics display and other places where memory is displayed graphically. In this example, guard blocks were used, and they are indicated by the lighter green area at the ends of the block
Selecting a checkbox tells MemoryScape that it should stop execution and notify you when the block is deallocated or reallocated.


