Customize the Display
Customizing the Display using “Group By”
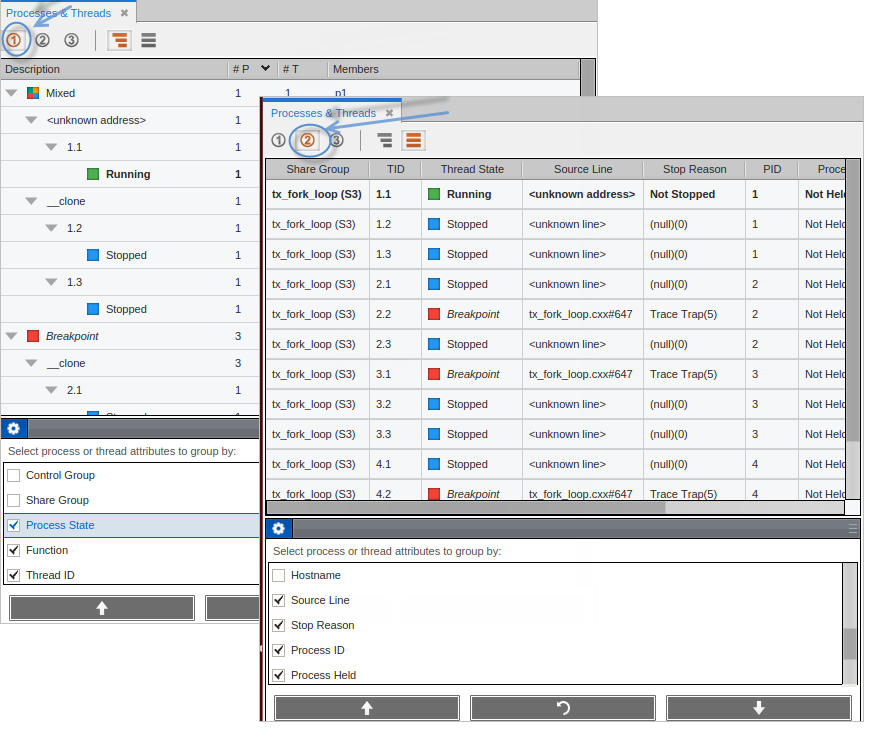
If the “Select process or thread attributes to group by” panel is not visible, click the gear icon ( ) to open it.
Checked selections appear in the View pane in the order that they appear in the “Group by” list. To change the order, select items in the list and use the up and down arrows. Reset restores the initial order. To hide the list, double-click its banner; redisplay it by double-clicking on the banner again or clicking the gear icon.
The Processes & Threads View Layout
For more information on ptlists, see "Compressed List Syntax (ptlist)" in the TotalView Reference Guide.
Customizing the Process and Threads View Pane
Control which columns to display by right-clicking in the banner and selecting column names to display or hide.
View a tabular representation of process and thread state by clicking the tabular icon ( ):
):
Figure 84, Process and Threads Tabular View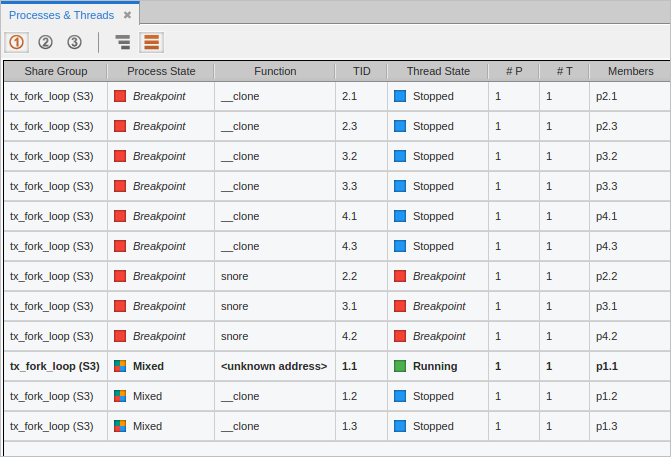

Sort the display by clicking on any of the column headers in either the tree or tabular view. To change the sort order between descending and ascending, click the column header again.
Figure 85, Reordering the Process and Threads View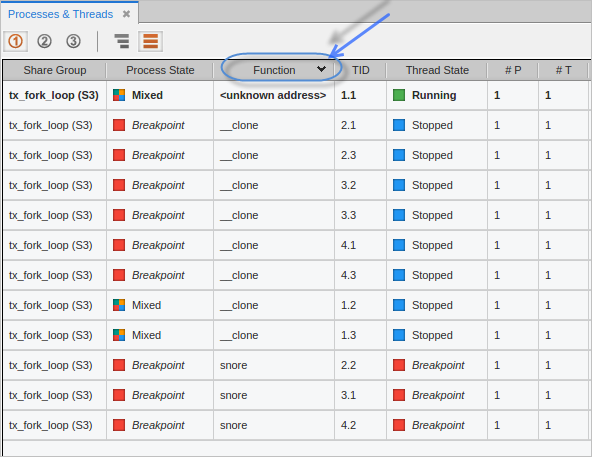

Here, the table has been sorted by Function, identified by the down arrow in the Function column header.
Customize multiple views using the three View icons ( ). Each view is independent and can have any combination and order of attributes. This provides a convenient way to have several different views into your program.
Figure 86, Process and Threads – Viewing Different Attributes