Example: Viewing a Guard Corruption Event Report
You can view corrupted guard blocks in your program in two ways:
When guard blocks are enabled, you’ll want to choose to generate a memory event report by selecting Debug > Stop on Memory Events from the menu (see Memory Event Reports) for the types of memory events that produce an event report.
If your program has overwritten memory and guard blocks are enabled, TotalView generates an event report when the memory is deleted, for example:
Figure 196, Memory Event Report on Guard Corruption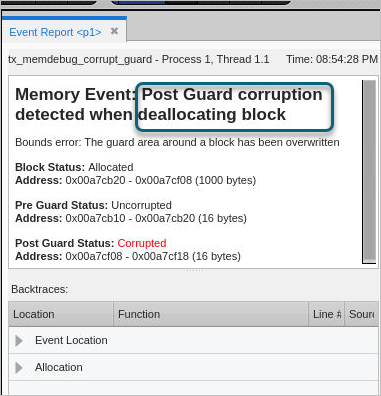

In this case, TotalView has identified a corrupt post-guard block at memory deallocation, with the following information:
The current status of this block is “allocated” at 1,000 bytes.
The previous status was uncorrupted, at 16 bytes.
The status is now corrupted, as it has been allocated with 1,000 bytes, overwriting the 16 bytes it previously had and corrupting memory outside of its allocation.
To find more information about this piece of memory, drill down into the Backtrace pane at the bottom of the event report:
Figure 197, Guard corruption event report, backtrace, deallocation event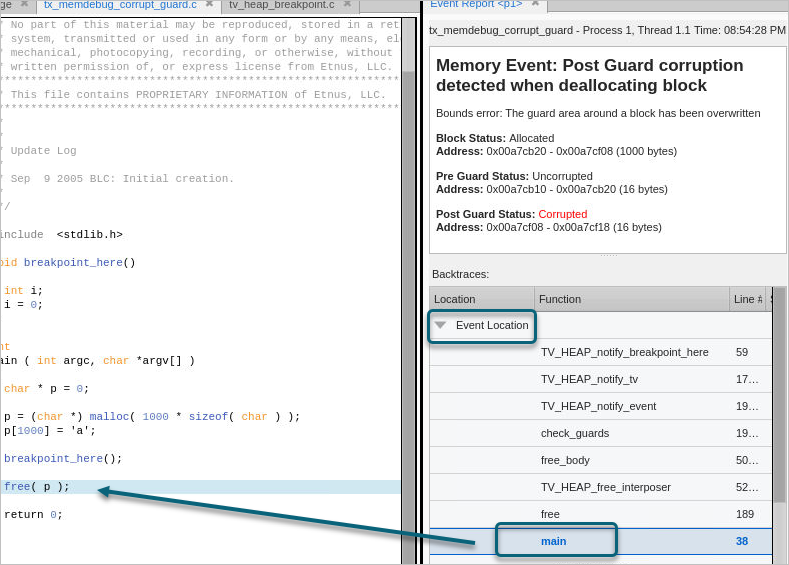

The Event Location dropdown in the Backtrace pane highlights the location of the deallocation, which occurred in main(). When selected, the focus in the Source view changes to the line where deallocation occurred.
To see the allocated block, drill down under Allocation in the Backtrace pane.
Figure 198, Guard corruption event report, backtrace, allocation event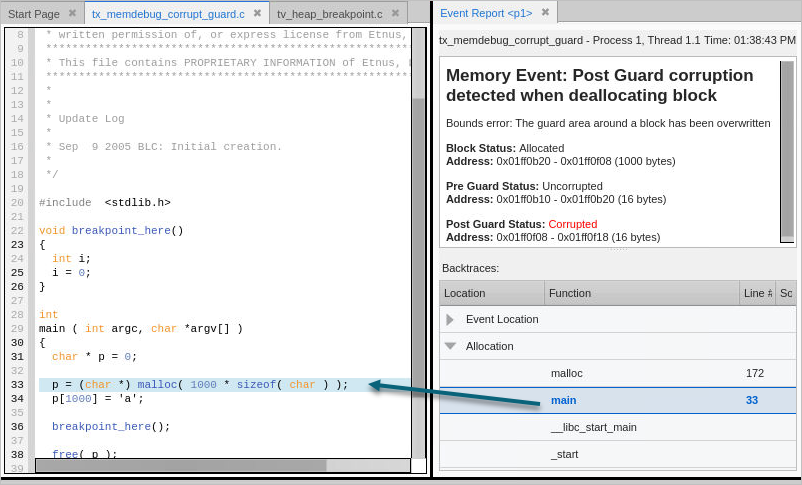

Here, note that the 1,000 bytes allocated in main, line 33, were subsequently overwritten, resulting in a corrupt guard.
Because you now know which block was corrupted, you can begin to locate where the overwrite occurred. In many cases, you will rerun your program, focusing on those blocks.


