Example: Guarding Allocated Memory
When guard blocks are enabled, you’ll want to also choose to generate a memory event report by selecting Debug > Stop on Memory Events from the menu (see Memory Event Reports).
If your program is overwriting memory and you have guard blocks enabled, TotalView will generate a guard corruption report, for example:
Figure 188, Memory Event Report on Guard Corruption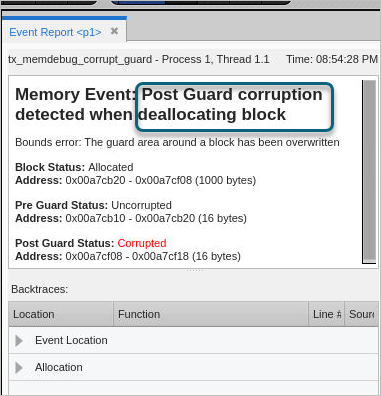

In this case, TotalView has identified a corrupt memory post-guard block occurring at memory deallocation, with the following information:
The current status of this block is “allocated” at 1,000 bytes.
The previous status was uncorrupted, at 16 bytes.
The status is now corrupted, as it has been allocated with 1,000 bytes, overwriting the 16 bytes it previously had and clearly corrupting memory outside of its allocation.
To identify where this occurred, let’s drill down into the backtrace pane at the bottom of the event report:
Figure 189, Guard corruption report, backtrace, deallocation event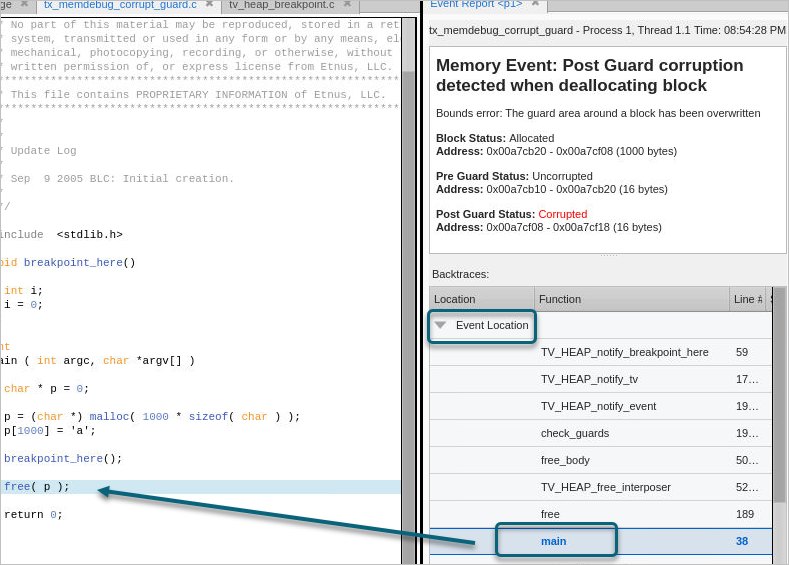

The Event Location dropdown in the Backtrace pane highlights the location of the deallocation event, which occurred in main. When selected, the focus in the Source view changes to the line where deallocation occurred.
To see the allocated block, drill down under Allocation in the Backtrace pane.
Figure 190, Guard corruption report, backtrace, allocation event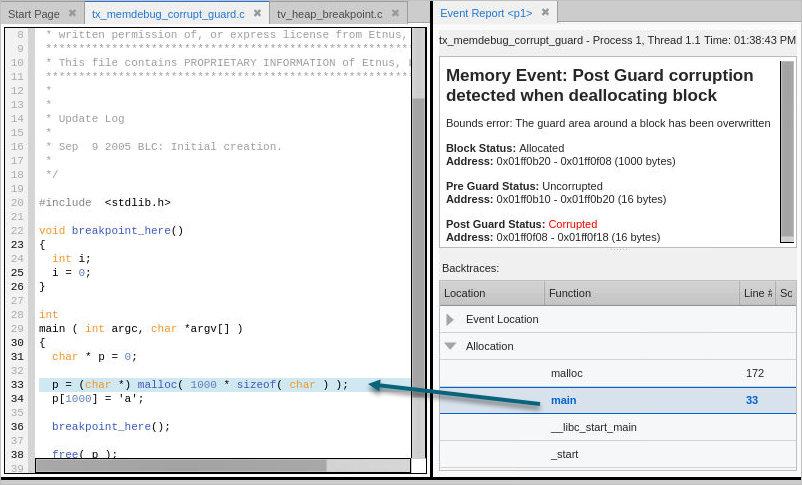

Here, note that 1,000 bytes were allocated in main, line 33. It was this allocation that resulted in corrupt memory.


