Zooming Into Data
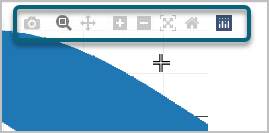
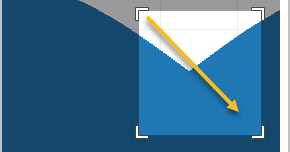
To view some data in detail, use the zoom toolbar, which displays when you place your cursor inside the graph:

 ).
).
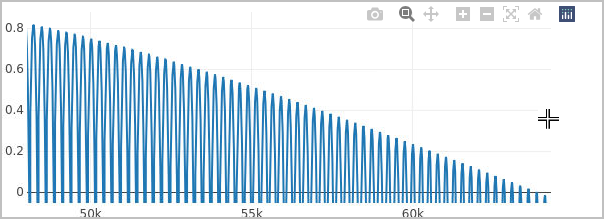
TotalView zooms in on your data:
Figure 76, Array View > zooming in on data

To undo the zoom, either double-click on the graph or select the Reset Axes home button ( ) or the Zoom out button (
 ).
).
 ) or the Zoom out button (
 ).
). If you know the indices you want to examine, you can also slice the array to view a subsection; see Slicing Arrays.
Slicing arrays to visualize or see statistics for a subsection of an array | |
Viewing arrays in the Data View | |
Displaying arrays |


