Sliding Breakpoints
If you try to set a breakpoint in the Source view at a location with no bolded line, i.e., if there are no line number symbols for that source code line yet, TotalView automatically “slides” the breakpoint to the next line number in the source file that does have a line number symbol.
For example, in Figure 39, a breakpoint was set at line 45 and slid to line 48 where there was a line number symbol. The Source view then displayed a hollow red box indicating that it slid, along with a solid red box at the slid location.
Figure 39, Sliding breakpoint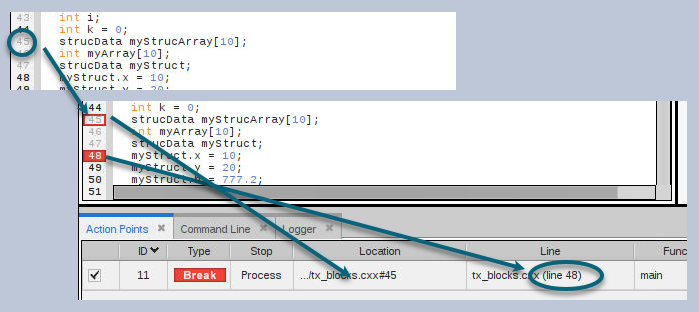
The Action Points Location column always displays the full breakpoint expression (in brackets). It also displays the "best" source file and line number it can currently find. TotalView does not change the original breakpoint expression, in the event that dynamically loaded code would be a better match later.
The breakpoint expression—pointing to line 45—is displayed in the Actions Points Location column as well as the location of the actual breakpoint at line 48. Retaining the original expression supports the situation in which a library that is dynamically loaded does have line number symbols at that location. As the program runs and dynamically loads code, TotalView reevaluates the breakpoint expressions, factoring in any new line number symbols it finds. If better-matching line number information is found, the address blocks in the breakpoint are updated to add the addresses of the new line number symbols, and possibly disable or invalidate old address blocks. This ensures that the breakpoint triggers for the most relevant source line.
If TotalView cannot find a line number symbol following the line specified in the breakpoint expression, it creates a pending breakpoint. For example, this could occur when setting a breakpoint at the end of a source file. See Pending Breakpoints for information.
Dynamic Code Loading Example
To see how this works, consider a program that will load code at runtime, such as when debugging CUDA code running on a GPU.
Figure 40 illustrates a breakpoint set at line 91 that has slid to line 134:
Figure 40, Sliding breakpoints when dynamically loading code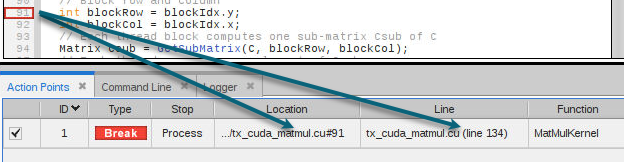
Once the program is running and the CUDA code is loaded, TotalView recalculates the breakpoint expression and is able to plant a breakpoint at line 91 in the CUDA code, which is an exact match for the breakpoint expression:
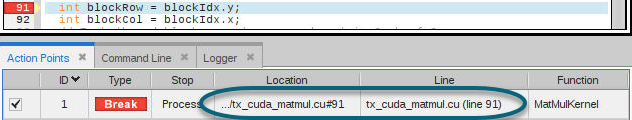
TotalView then disables the slid breakpoint at line 134 since it found a better match. Verify this using the dactions command in the CLI:
1.<> dactions -full -block_lines
1 shared action point for group 3:
1 [/home/totalview/cuda-example/tx_cuda_matmul.cu#91] Enabled
Address 0: [Disabled] MatMulKernel+0x18, tx_cuda_matmul.cu#134 (0x0040372d)
Address 1: [Enabled] MatMulKernel+0xae0, tx_cuda_matmul.cu#91 (Location not mapped)
Share in group: true
Stop when hit: process


