Debugging with a Replay Recording File
Previously saved Replay recording files can be loaded to further debug applications. These recording files contain the state of a previous debugging session, including all Replay information.
To debug with a replay recording file, select either
The Core or Replay Recording File Session dialog launches. Enter a name for the session, the program, and replay recording file's name.
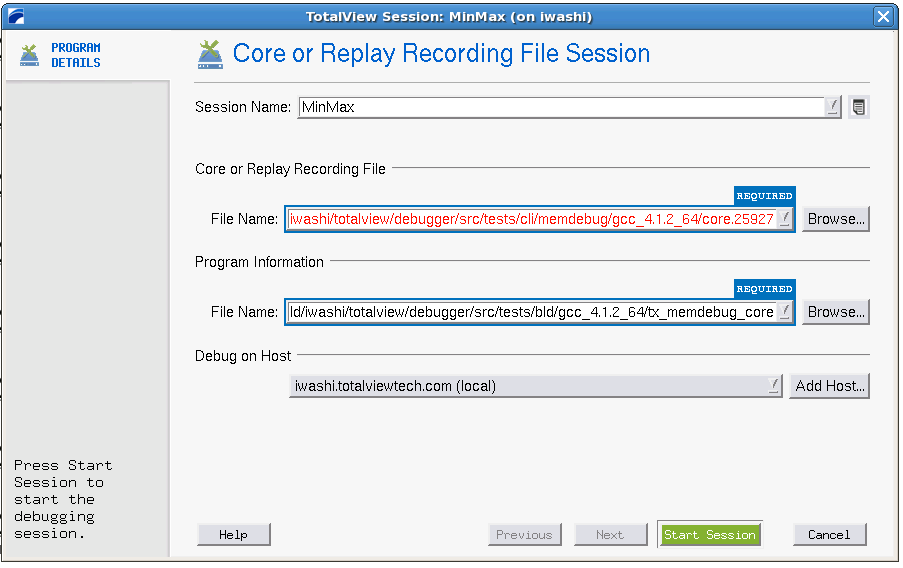 |
If the program and replay recording file reside on another system, enter that system's name in the Debug on Host area (see Adding a Remote Host for details).
When TotalView launches, the Process Window displays the replay recording file, with the Stack Trace, Stack Frame, and Source Panes showing the state of the process when the replay session was saved. The title bar of the Process Window displays “Recording File”. The right arrow in the line number area of the Source Pane indicates the value of the program counter (PC) when the process was saved.
You can examine the state of all variables at the time the replay recording file was saved. See Chapter 12, Examining and Editing Data and Program Elements .
Debugging with a Replay recording file | The File > Debug Core or Replay Recording File dialog in the in-product Help |
The CLI dattach command’s -c recording-file option | dattach in the Classic TotalView Reference Guide |


