The Parallel Program Session Dialog
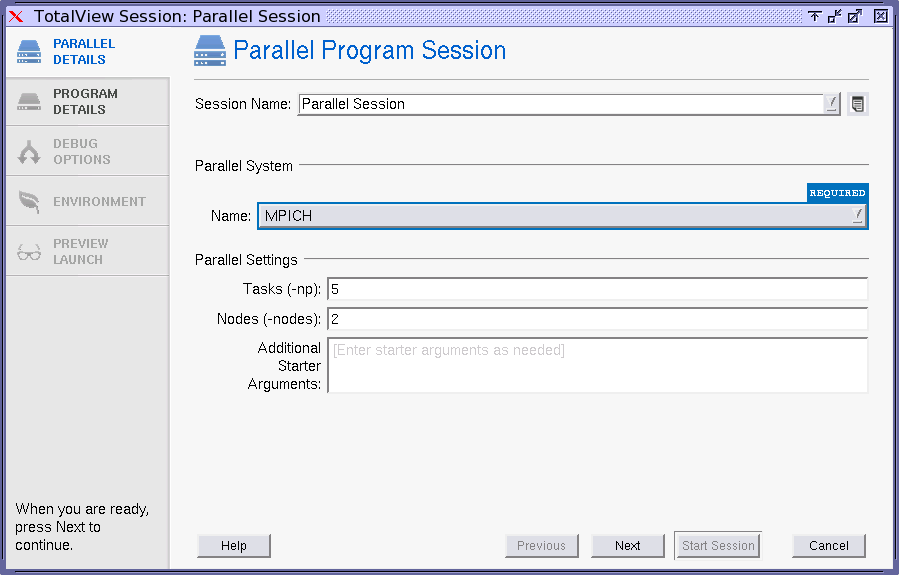 |
1. Enter a session name in the Session Name field.
NOTE: Any previously entered sessions of the same type are available from the Session Name dropdown box. Once selected, you can change any session properties and start your debug session. See Editing or Starting New Sessions in a Sessions Window.
2. Select the Parallel system, the number of Tasks, and Nodes.
3. (Optional) Enter any additional arguments required by the starter process into the Arguments area. Note that these arguments are those sent to a starter process such as mpirun or poe. They are not arguments sent to your program.
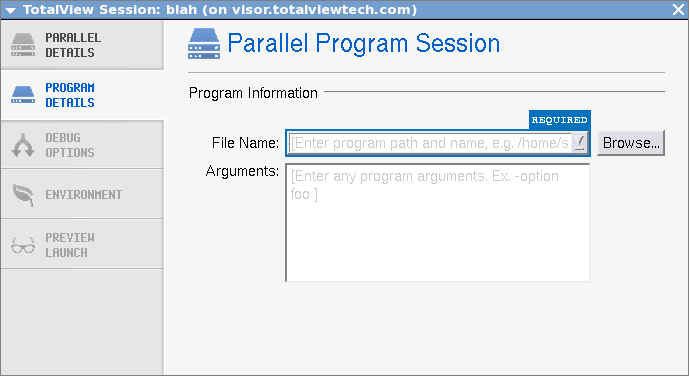
4. Select the Program Details tab to enter the file name of the program being debugged and any arguments to be sent to your program.
 |
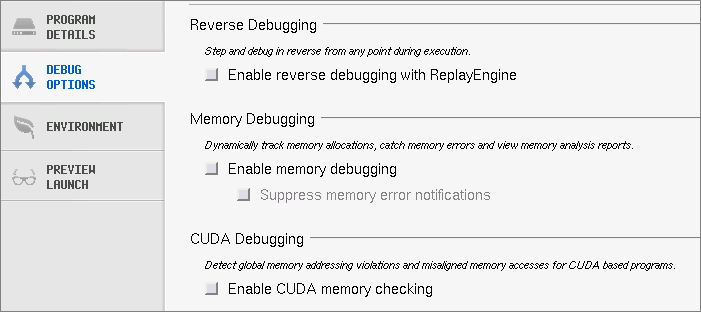
5. Select any optional settings:
 |
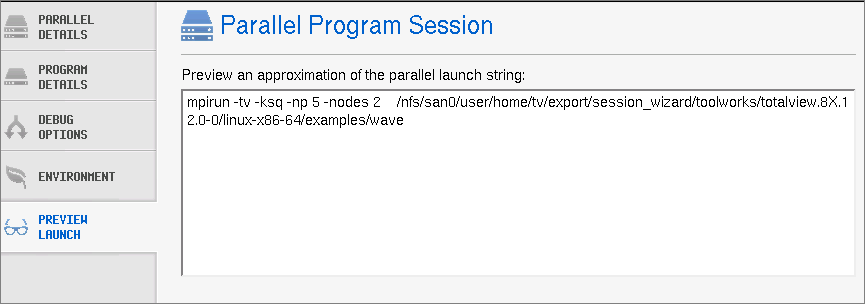 |
6. Select the Start Session button to launch the TotalView.
Once created, a session named my_foo can be quickly launched later using the -load command line option, like so:
totalview -load_session my_foo


