Memory Debugging
TotalView has a fully integrated version of the MemoryScape product for debugging memory issues. MemoryScape is also available as a standalone product.
MemoryScape can monitor how your program uses malloc() and free() and related functions such as calloc() and realloc(). For example, the C++ new operator is almost always built on top of the malloc() function. If it is, MemoryScape can track it.
You must enable memory debugging before you start running your program. Once you have loaded a program to debug in TotalView, select Debug > Open MemoryScape to launch the primary MemoryScape window.
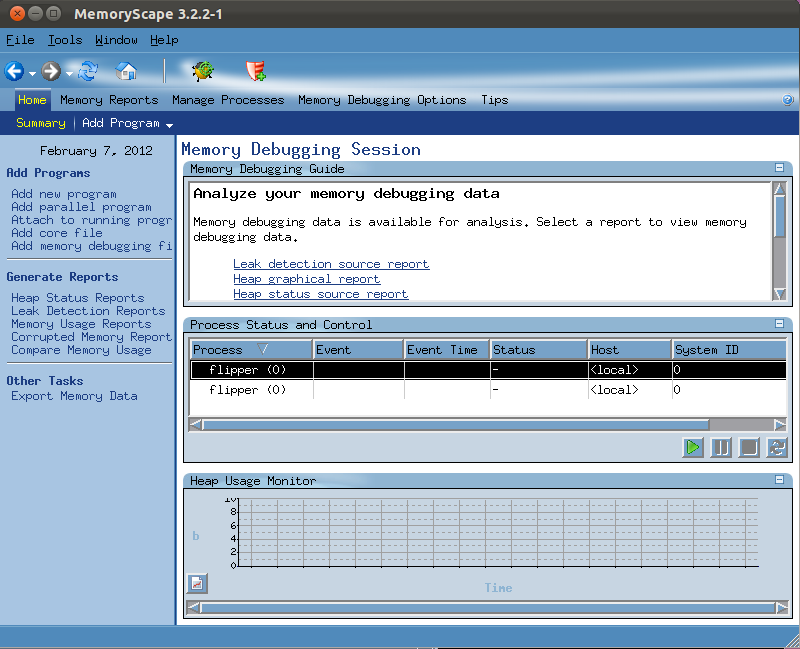 |
MemoryScape has its own user guide |


