Visualizing Arrays
The Visualizer is a special tool to graphically visualize array data. This is a powerful and easy way to view your program’s data during debugging and is useful in discovering anomalies in data value range, numerical spikes, and NaNs.
NOTE: These procedures on visualizing arrays can be performed independently of the other tasks discussed in this chapter, but you must first load the program (Load the Program to Debug). In addition, the discussion assumes an existing eval point has been set, as described in Evaluation Points.
You can launch the Visualizer either directly from the GUI or from within an eval point.
From the GUI
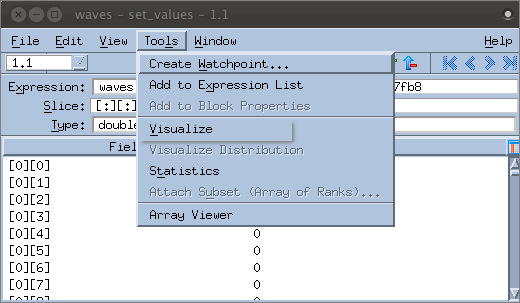
Select an array in a Variable Window, and then select Tools > Visualizer.
 |
From within an eval point
Invoke the Visualizer using the $visualize command, with this syntax:
$visualize ( array [, slice_string ])
Launching from an eval point also provides the ability to stop program execution if desired.
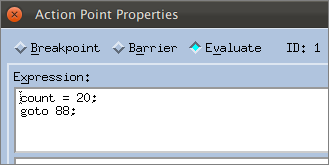
This discussion uses the $visualize command in an eval point to launch the Visualizer to view the waves array. This array increments the value of XSIZE and YSIZE to create a visual wave.
Set Up
 |


