The Call Tree and Call Graph
The Call Tree or Call Graph, accessible from the Process Window using the command Tools > Call Graph, provides a quick view of application state and is especially helpful for locating outliers and bottlenecks.
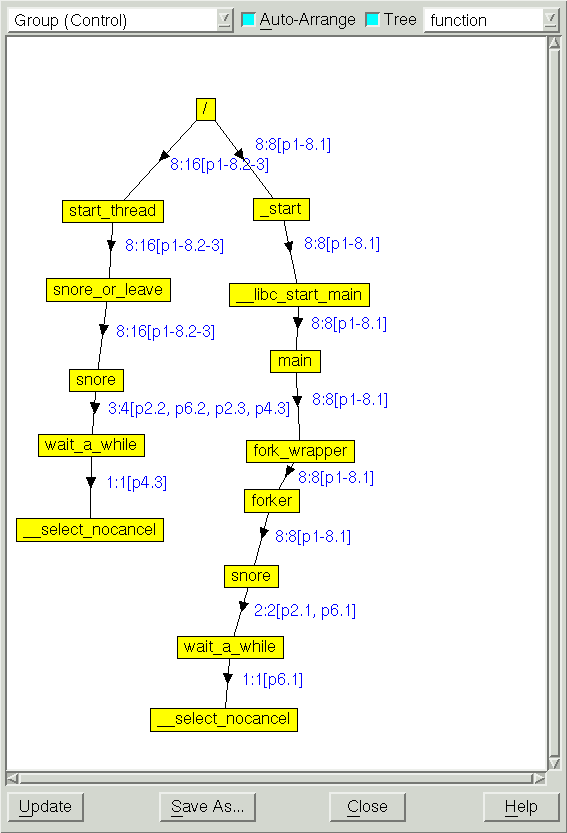 |
By default, the Call Tree or Call Graph displays the Call Tree representing the backtrace of all the selected processes and threads.
For multi-process or multi-threaded programs, a compressed process/thread list (ptlist) next to the arrows indicates which threads have a routine on their call stack. You can dive on a routine in the call tree/graph to create a group called call_graph that contains all the threads that have the routine you dived on in their call stack.
The Call Tree or Call Graph in more detail | |
Using the CLI’s dwhere -group_by option to control and reduce the backtraces | |
About the ptlist | |
Using the Tools > Call Graph command | Tools > Call Graph in the in-product Help |


