Task 16: Painting Memory
Your program may be using memory either before it is initialized or after it is deallocated. MemoryScape can help you identify these kinds of problems by initializing allocated or deallocated memory to a bit pattern. This is called painting. If you can recognize this bit pattern, you’ll be taking a large step toward identifying the problem.
Before reading this task, you should be familiar with the following information:
An overview of memory concepts and MemoryScape.
How to start MemoryScape with an overview of the kinds of information you can obtain.
How to configure MemoryScape so that it performs the activities you want it to perform.
How to start and stop program execution.
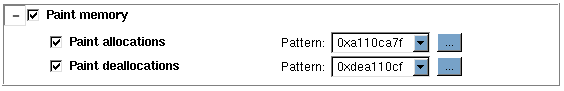
To enable painting memory, select Extreme from the Memory Debugging Options screen (described in Task 3: Setting MemoryScape Options.) If you need to tune how MemoryScape paints memory, select Advanced Options. Here is the portion of the options screen for setting painting options:
Figure 74: Paint memory option |
 |
Here are some of the ways in which you use painting:
• If you paint memory and your application displays this memory, you will have proof that you are using uninitialized or deallocated memory.
• Painting memory provides consistency for uninitialized memory in that you should not experience situations where the program works for some users and doesn’t for others.
• Painting memory will change your program’s behavior if it is not using memory correctly. This may aid in identifying the problem. In addition, it may correct the problem so that the program doesn’t appear to fail.
• Some painting patterns can force an error such as a crash to occur. (Crashes during debugging sessions are useful, allowing you to identify where problems are occurring.)
• After painting memory, your program can look for the pattern in order to check if something was not initialized.


