The Call Stack
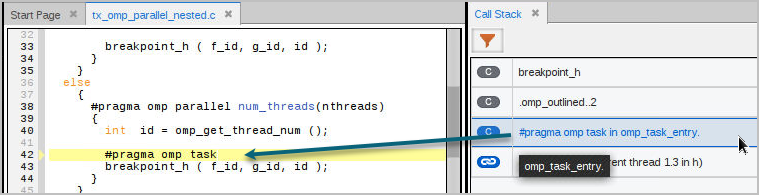
For OpenMP, the Call Stack identifies parallel and task regions using the annotations "#pragma omp parallel” or "#pragma omp task", depending on whether the frame is associated with an implicit (parallel) or explicit (task) task.
For example, consider an OpenMP program with a single parallel region and multiple threads. When a breakpoint is hit and you focus on a thread in the Processes & Threads view, that thread’s backtrace displays in the Call Stack, as usual: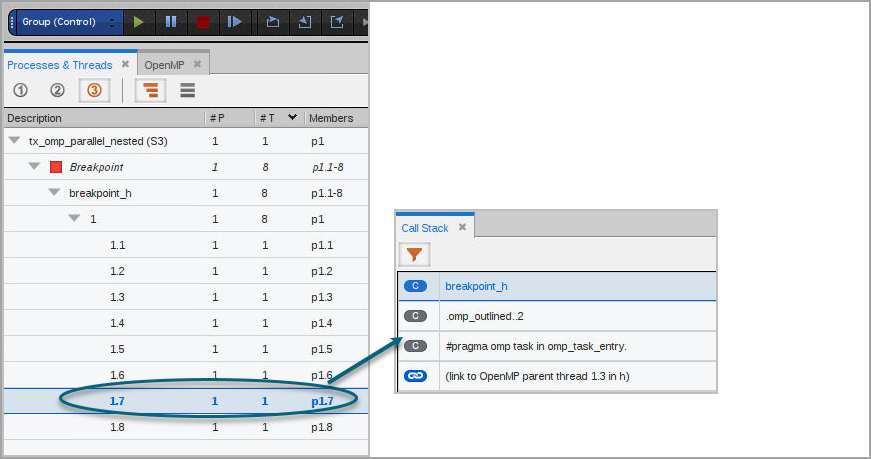
Observe the following:
NOTE: The pragma annotations are language-sensitive and show "#pragma" for C/C++ OMP code and "!$omp" for Fortran code.
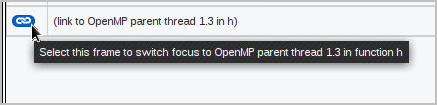
Clicking this link focuses the source pane on its parent thread’s stack frame for function h, which in turn updates the Call Stack for the backtrace for thread 1.3: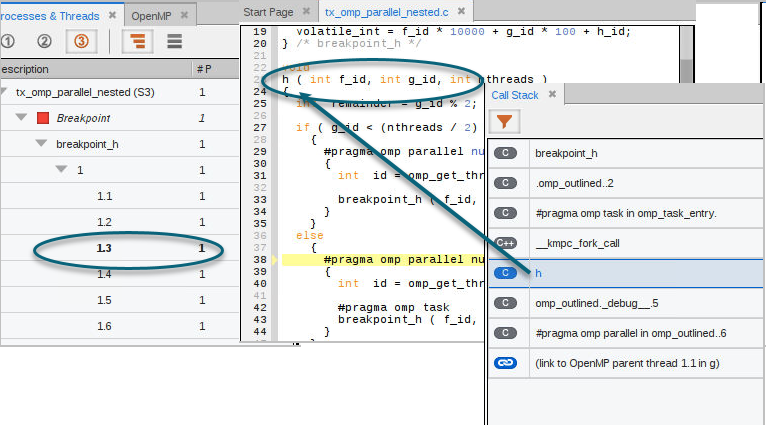
This parent/child stack linking continues through the backtrace until the initial thread 1.1, is reached.


