Slicing Arrays
Here is a two-dimensional array containing 400 elements.
You can slice an array in the Array Statistics view to generate stats on a sub-portion, by editing the Slice field: 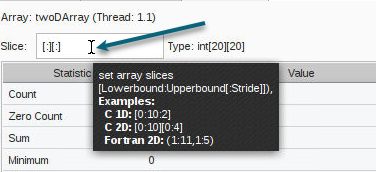
Note that hovering your cursor over the Slice field provides examples of some slice definitions. The general form for a slice definition is:
lower_bound:upper_bound[:stride]
For example, [0:9][0:9] would use only elements 0 through 9 of each dimension, cutting the number of elements used to calculate the statistics to 100.
The default value for stride is 1; that is, show all elements in the range. If a stride of 2 were added to one of the dimensions above, the statistical calculations would use every other element, cutting it to 50: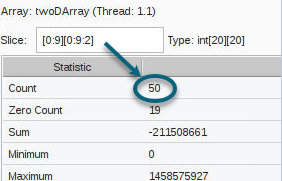
To analyze the stats of just the second dimension of the array, you could hold the first dimension steady, for example, [0:0][:]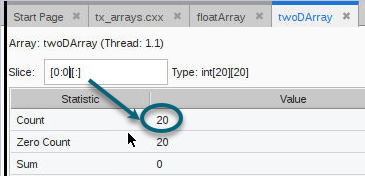
NOTE: To first edit the data before slicing it and viewing it in the Array Statistics view, use the Local Variables or Data View.
If you have cast the type to some other shape array in the Local Variables view or Data View before launching the Array Statistics view, the edited data is displayed there. For example, editing this array in the Data View is then reflected when the array is added to the Array Statistics view: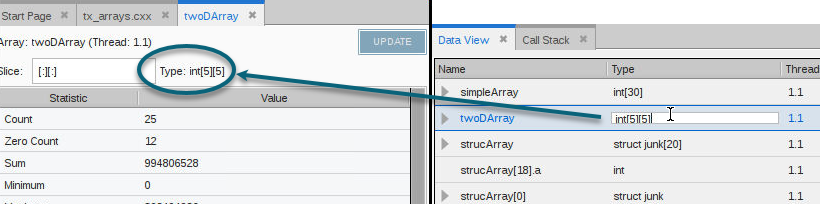
Array statistics are also available through the CLI, as switches to the dprint command.


