Creating a Pending Evalpoint
You can create a pending evalpoint at a location in your code that hasn’t yet been loaded, for instance, when your program will dynamically load libraries at runtime. Setting a pending evalpoint is, essentially, allowing its expression to fail compilation when it is created. For example, it may reference a local variable in the code that will not be defined in the symbol table until the code is loaded and TotalView reads the debug symbols. When your program loads new code at an evalpoint location, TotalView will attempt to compile the expression. If the evalpoint expression still fails to compile, the evalpoint is handled like a breakpoint.
To create a pending evalpoint, simply create an evalpoint at the source line where you know dynamically loaded code will be. Once you click Create Evaluation Point in the Create Evaluation Point dialog and TotalView can’t locate any debug symbols for that line, a pop-up prompts you to choose to create a pending evalpoint: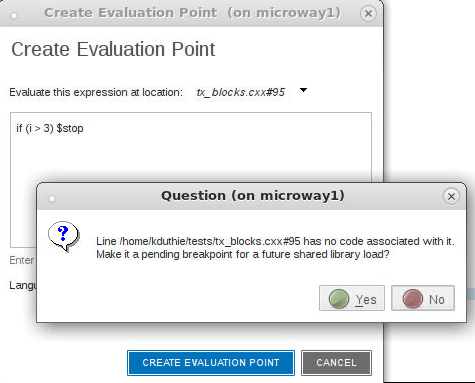
If you click Yes, the evalpoint is created, identified as pending with an orange boxed line in the Source view and a “pending” identifier in the Action Points tab: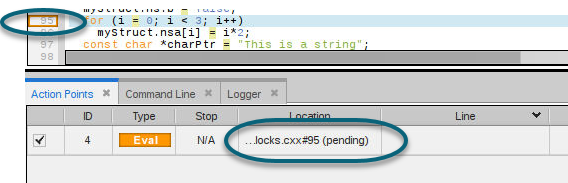
A pending eval point is one in which:
Note that the "Create a pending evalpoint" flag sticks to the evalpoint for the duration of the debug session. The flag is not saved with the eval point when TotalView saves action points; however, when restoring the action points, TotalView will set the flag if the underlying breakpoint needed to slide or was pending.
For more information on pending breakpoints, see Pending Breakpoints.


