Starting Memory Debugging in TotalView
On most architectures, there is little you need to do to prepare your program for memory debugging. In most cases, just compile your program using the -g command-line option. In some cases, you may need to link your program with the TotalView’s Heap Interposition Agent. (See How TotalView Intercepts Memory Data and Linking Your Application with the Agent for more information.)
NOTE: TotalView must be able to preload your program with its agent. In many cases, it does this automatically. However, it cannot preload the agent for applications that run on IBM RS/6000 platforms. For more information, see Linking Your Application with the Agent.
For more general information on preparing programs to debug memory issues, including platform-specific details, see Preparing Programs for Memory Debugging.
For more general information on preparing programs to debug memory issues, including platform-specific details, see Preparing Programs for Memory Debugging.
To start debugging memory in TotalView:
1. Start TotalView and load a debugging session in the normal way.
See Starting TotalView and Creating a Debugging Session for detail.
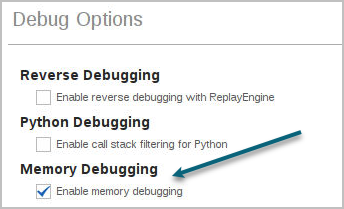
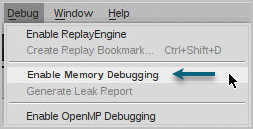
2. Enable Memory Debugging, in these ways:
Whenever your program is stopped—which happens when you halt the program, when a memory problem occurs, or just before the program exits—TotalView can create a report that describes leaks.


