Launching the Visualizer from an Eval Point
1. Add an eval point
$visualize(waves,"[::4][::4]");
$stop;
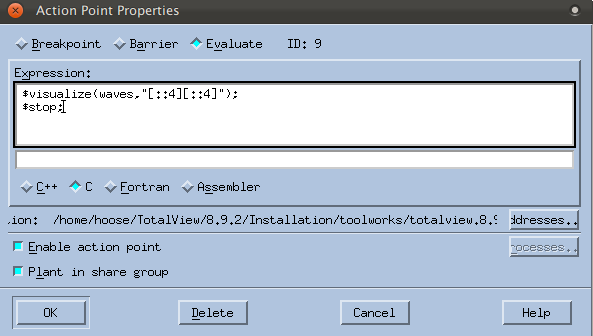 |
When the eval point is hit, this code will launch a single Visualizer window that will display every fourth element in the major dimension (the X axis), and then program execution will stop. To display the entire array, you could just write:
$visualize(waves); // entire array
(Note that the code comments suggest launching two Visualizer windows. For purposes of this discussion, we’ll add just one.)
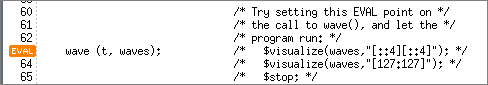 |
2. Run the program and view the data
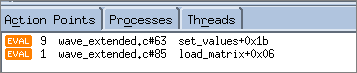
At this point, the program should have no regular breakpoints and two eval points:
 |
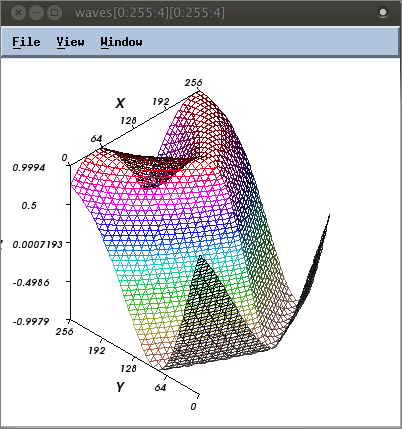
The program runs to the eval point at wave() and then stops. The Visualizer launches, reflecting the array’s initial values:
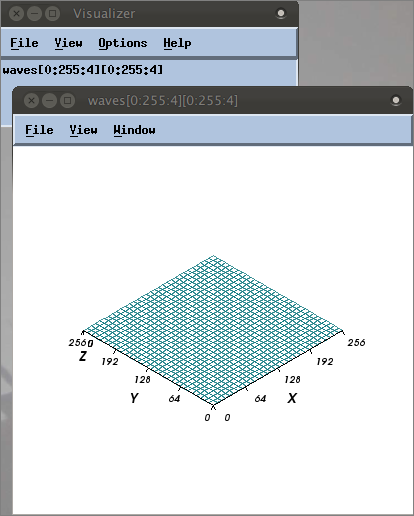 |
Above are the Visualizer’s two windows: the top window is the Dataset window listing all datasets available to visualize (only one dataset has been loaded into the Visualizer at this point); the bottom is the View window where the graphical display appears.
3. Complete the program
You can watch the wave build, for example:
 |
4. Run the program without stopping execution
An eval point does not have to stop execution. To let the program run without interruption, just remove the $stop command from the Expression field in the Action Point Properties dialog, then click Go.
The Array Visualizer | |
More ways to use view arrays |


