Using the Process Window
The Process Window contains panes that display the code for the process or thread that you’re debugging, as well as other related information. In the middle is the Source Pane. (The contents of these panes are discussed later in this section.
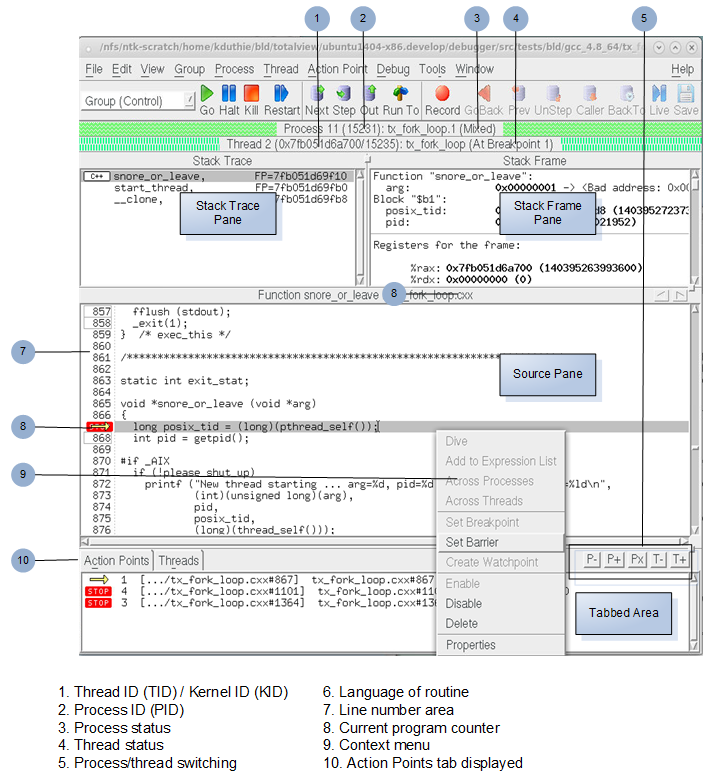 |
As you examine the Process Window, notice the following:
In other windows, TotalView uses the pid.tid value to identify a process’s threads.
The Threads Tab shows the threads that currently exist in a process. When you select a different thread in this list, TotalView updates the Stack Trace, Stack Frame, and Source Pane to show the information for that thread. When you dive on a different thread in the thread list, TotalView finds or opens a new window that displays information for that thread.
You can place a breakpoint at any line whose line number is contained within a box indicating that this is executable code. You can also click on a line without a breakpoint box to create a sliding or pending breakpoint. (See Sliding Breakpoints and Pending Breakpoints).
The Source Pane display unifies source-line breakpoint boxes across all image files within the share group that contain the source file. For example, the source-line breakpoint boxes will be unified for all instances of a source file or header file that is compiled into multiple shared libraries used by the process.
The Source Pane display unifies source-line breakpoint boxes across all image files within the share group that contain the source file. For example, the source-line breakpoint boxes will be unified for all instances of a source file or header file that is compiled into multiple shared libraries used by the process.
When you place a breakpoint on a line, TotalView places a  icon over the line number. An arrow over the line number shows the current location of the program counter (PC) in the selected stack frame.

Each thread has its own unique program counter (PC). When you stop a multi-process or multi-threaded program, the routine displayed in the Stack Trace Pane for a thread depends on the thread’s PC. Because threads execute asynchronously, threads are stopped at different places. (When your thread hits a breakpoint, the default is to stop all the other threads in the process as well.)
The Action Points Tab with the Tabs Pane shows the list of breakpoints, eval points, and watchpoints for the process.
The Threads Tab shows each thread and information about the thread. Selecting a process switches the context to that thread.
The Processes/Ranks tab, if present, displays a grid of all of your program's processes. The grid’s elements show process status and indicate the selected group. Selecting a process switches the context to the first thread in that process.
The Processes/Ranks Tab was displayed by default in previous versions of TotalView, but now it is off by default. This is because it can significantly affect performance, particularly for large, massively parallel applications. The tab can be turned back on with the command line switch ‑processgrid and/or by setting TV::GUI::process_grid_wanted to true in the .tvdrc file. If you enable this tab in the .tvdrc file, you can disable it for a particular session with the ‑noprocessgrid command line switch.
More on using the Process Window | The “Process Window” in the in-product Help |
More on the Processes/Ranks tab | The topic Using the Processes/Ranks and Threads Tabs in this user guide. |


