Tools > Statistics
Displays statistics for the displayed array elements. If the Variable Window contains a slice expression or a filter, only these values are used when TotalView creates the statistical information.
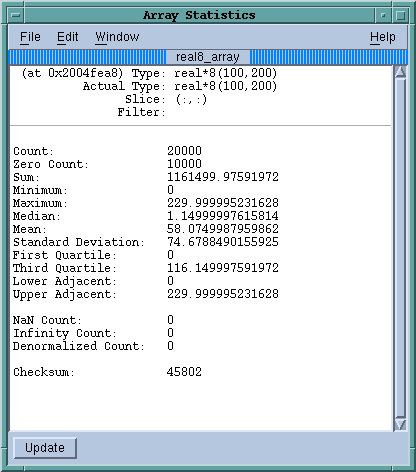 |
The statistics calculated are:
Adjacents
Displays the lower and upper adjacents. The lower adjacent provides an estimate of the lower limit of the array. Values below this limit are called outliers. The lower adjacent value is the first quartile value less 1.5 times the difference between the first and third quartiles.
The upper adjacent value provides an estimate of the upper limit of the array. Values above this limit are called outliers. The upper adjacent value is the third quartile value plus 1.5 times the difference between the first and third quartiles.
Checksum
A checksum value for the array elements.
Count
The number of elements that participated in the statistical calculations. For floating-point arrays, this does not include any NaN or infinity (INF) values.
Denormalized Count
A count of the number of denormalized values found in a floating-point array. This includes both negative and positive denormalized values as defined in the IEEE floating-point standard. These elements do participate in the statistical calculations.
Infinity Count
A count of the number of infinity (INF) values found in a floating-point array. This includes both negative and positive infinity as defined in the IEEE floating-point standard. These elements do not participate in statistical calculations.
Maximum
The largest value in the array.
Mean
The mean value of the array.
Median
The median value of the array.
Minimum
The smallest value in the array.
NaN Count
A count of the number of NaN values found in a floating-point array. This includes both signaling and quiet NaNs as defined in the IEEE floating-point standard. These elements do not participate in statistical calculations.
Quartile
Displays either the first or third quartile. The first quartile is the 25th percentile value in the array. That is, 25 percent of the array values are smaller than this value and 75 percent are greater.
The third quartile is the 75th percentile value in the array. This means that 75 percent of the array values are less than this value and 25 percent are greater.
Standard Deviation
The standard deviation of the array values.
Sum
The summation of all the array elements.
Zero Count
The number of elements that have a value of 0.


