Program Created
After adding a file, MemoryScape displays a screen that guides you on what to do next. The screen shown here is the one shown after you add a program. Similar screens are displayed after performing other tasks.
Move your cursor over the graphic to obtain help.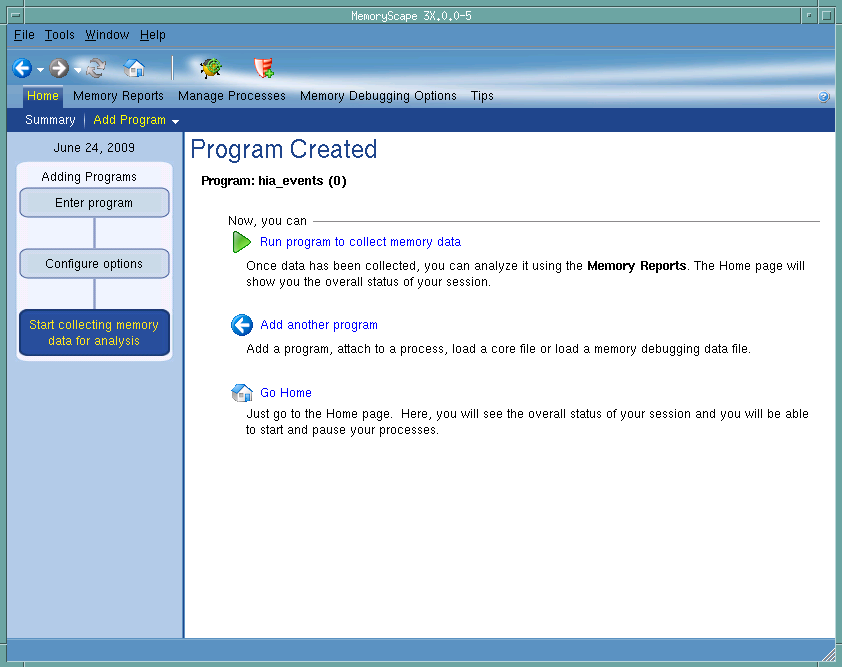
Adding Programs
This chart shows how many steps are involved in adding a file and where you are in this process. This example lets you know that this is the last stop in the process of adding a file.
Program name
Tells you what program or file you have just added.
Run program to collect memory data
Clicking this button tells MemoryScape to run this program. MemoryScape responds by displaying its Memory Debugging Session screen.
Add another program
Click this button to add another file or program to this session. After clicking this button, MemoryScape displays its Add Programs to Your Memory Debugging Session screen.
Go home
Tells MemoryScape to displays its Memory Debugging Session screen.
Debug in TotalView
Tells MemoryScape to open the currently selected process in TotalView. The TotalView process window will display the current state of that process. You must have a TotalView license available to debug in TotalView.
Be aware that opening the TotalView process window from within MemoryScape does not initialize TotalView in the same way as starting TotalView directly. The definitions in your .tvdrc file and your saved breakpoints are not loaded. However, you can load a breakpoint file using the Action Point menu item in the process window. If you need the definitions in your .tvdrc file, start TotalView first and open MemoryScape from within TotalView.
Red Zones
Tells MemoryScape to set the Red Zones option on or off for the selected processes.
This screen shows the third step of adding a program. If you are adding a different kind of file (for example, a memory debugging file), it may look different and have different (but similar) controls.


