Memory Debugging Options: Basic
Use this screen to set the level of memory debugging. The options on this page give you default settings for debugging capabilities. If you need to modify these options, click the Advanced button. The information on this page describing these basic options is brief. For detailed information, see “Task 3: Setting MemoryScape Options.”
Move your cursor over the graphic to obtain help.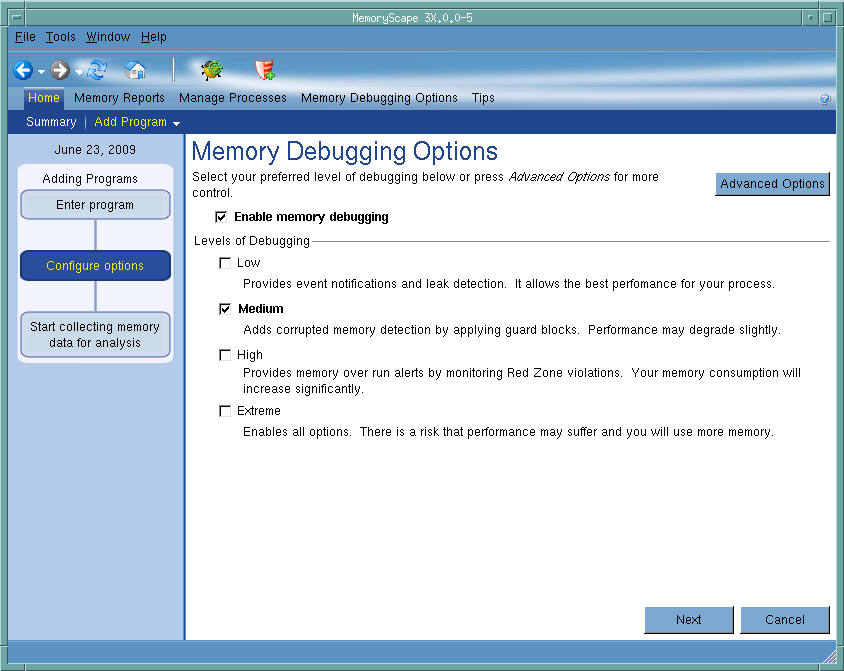
Adding Programs
This chart shows how many steps are involved in adding a file and where you are in adding a file.
Advanced Options
Click the button to display the advanced version of the Memory Debugging Options screen. That screen lets you individually manipulate what MemoryScape does In addition, that screen lets you individually configure process options.
Low
When enabled, MemoryScape records all malloc library actions. This lets it perform leak detection and stop execution when problems occur with calls to this library. The performance of your program is not materially affected.
Medium
When enabled, MemoryScape performs the actions indicated when Low is enabled. It also adds guard blocks to memory allocations. The performance impact of this option is greater than when Low is enabled and the performance impact depends upon how often the program allocates and deallocates memory blocks. While guard blocks consume additional memory, this is usually not something to be concerned with.
High
When enabled, MemoryScape performs the actions indicated when Low is enabled. It also adds Red Zones. This option notifies you when you access memory beyond the bounds of your allocation. This is an overrun. Red Zones have the potential of increasing memory consumption significantly and should be used only as needed. You can select Low, and use the Red Zone button on the task bar to turn Red Zones on for suspect allocations.
Extreme
When enabled, MemoryScape performs the actions indicated when Low, Medium and High are enabled. It also adds hoarding and painting. This option decreases performance and increases memory use significantly.
Debug in TotalView
Tells MemoryScape to open the currently selected process in TotalView. The TotalView process window will display the current state of that process. You must have a TotalView license available to debug in TotalView.
Be aware that opening the TotalView process window from within MemoryScape does not initialize TotalView in the same way as starting TotalView directly. The definitions in your .tvdrc file and your saved breakpoints are not loaded. However, you can load a breakpoint file using the Action Point menu item in the process window. If you need the definitions in your .tvdrc file, start TotalView first and open MemoryScape from within TotalView.
Red Zones
Tells MemoryScape to set the Red Zones option on or off for the selected processes.


