Memory Usage Process Report
Use this screen to see how your processes are using computer memory. That is, this information shows all memory usage, not just heap memory usage. For more information, see “Task 5: Seeing Memory Usage.”
Move your cursor over the graphic to obtain help.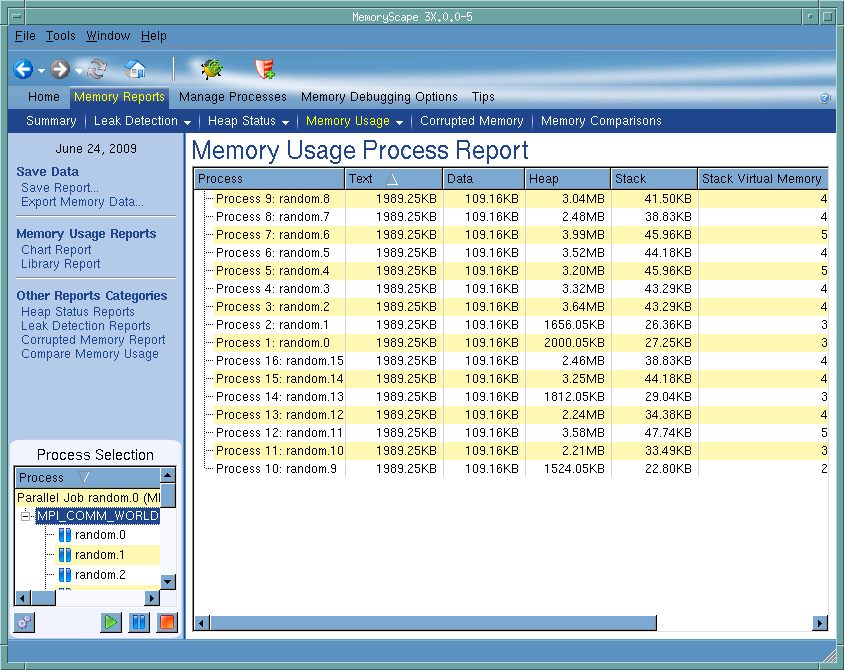
Process Selection
Shows the process and files being used for the comparison. The symbol to the left of the process name tells you the process’ execution status or if it is a memory debugging file, which is indicated by a disk symbol ( ).
).
).Execution Controls
These controls let you refresh or create ( ) this report, run (
 ), or halt (
 ) your program.
), or halt () your program.Process Information
Lists all of your processes and information about them. The information in this table is as follows:
Text: The amount of memory used to store your program’s machine code instructions.
Data: The amount of memory used to store uninitialized and initialized data.
Heap: The amount of memory currently being used for data created at run time.
Stack: The amount of memory used by the currently executing routine and all the routines in its backtrace.
Stack Virtual Memory: The logical size of the stack. This value is the difference between the current value of the stack pointer and the value reported in the Stack column.
Total Virtual Memory: The sum of the sizes of the mappings in the process's address space.
Debug in TotalView
Tells MemoryScape to open the currently selected process in TotalView. The TotalView process window will display the current state of that process. You must have a TotalView license available to debug in TotalView.
Be aware that opening the TotalView process window from within MemoryScape does not initialize TotalView in the same way as starting TotalView directly. The definitions in your .tvdrc file and your saved breakpoints are not loaded. However, you can load a breakpoint file using the Action Point menu item in the process window. If you need the definitions in your .tvdrc file, start TotalView first and open MemoryScape from within TotalView.
Red Zones
Tells MemoryScape to set the Red Zones option on or off for the selected processes.


