Memory Usage Chart Report
Use this screen to display charts of how your program is using memory. You can obtain pie, line, bar, and stacked bar charts. In addition, you can control the type of memory that MemoryScape graphs. While this illustration shows a pie chart, the explanations of the areas of other charts is nearly the same.
For more information, see “Task 5: Seeing Memory Usage.”
Move your cursor over the graphic to obtain help.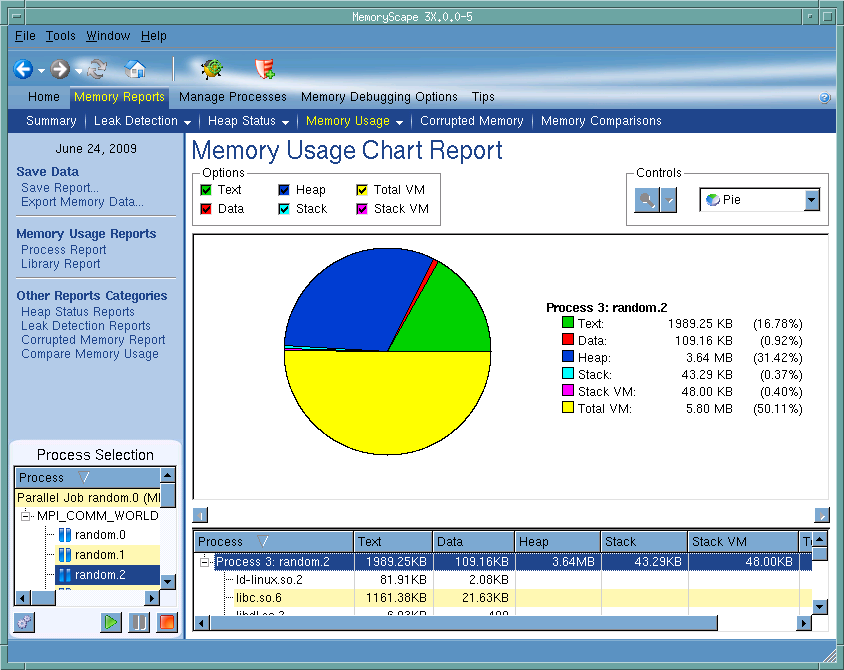
Process Selection
Contains a list of processes and files added to this memory debugging session. MemoryScape only graphs selected processes.
Execution controls
These controls let you refresh or create ( ) this report, run (
 ), or halt (
 ) your program.
), or halt () your program.Options
When a button is selected, that kind of memory is displayed. Your choices are:
Text: The amount of memory used to store your program’s machine code instructions.
Data: The amount of memory used to store uninitialized and initialized data.
Heap: The amount of memory currently being used for data created at run time.
Stack: The amount of memory used by the currently executing routine and all the routines in its backtrace.
Stack Virtual Memory: The logical size of the stack. This value is the difference between the current value of the stack pointer and the value reported in the Stack column.
Total Virtual Memory: The sum of the sizes of the mappings in the process's address space.
Zoom controls
The zoom controls let you change how much information is being displayed. If you select the arrow, MemoryScape displays four items that let you zoom in or out, reset the report, of fit the display to the window. Clicking on the icon changes the display.
Chart type
Use this pulldown to select how MemoryScape will graph memory usage. Your choices are: pie, bar, stacked bar, and line.
Chart area
This area contains the chart. Note the scroll bars. They are easy to overlook and, if you are running a multiprocess or multithreaded program, there may be considerable information that cannot be displayed in one screen.
Process information area
Contains table of how your processes are currently using memory. The information displayed is as follows:
Text: The amount of memory used to store your program’s machine code instructions.
Data: The amount of memory used to store uninitialized and initialized data.
Heap: The amount of memory currently being used for data created at run time.
Stack: The amount of memory used by the currently executing routine and all the routines in its backtrace.
Stack Virtual Memory: The logical size of the stack. This value is the difference between the current value of the stack pointer and the value reported in the Stack column.
Total Virtual Memory: The sum of the sizes of the mappings in the process's address space.
Debug in TotalView
Tells MemoryScape to open the currently selected process in TotalView. The TotalView process window will display the current state of that process. You must have a TotalView license available to debug in TotalView.
Be aware that opening the TotalView process window from within MemoryScape does not initialize TotalView in the same way as starting TotalView directly. The definitions in your .tvdrc file and your saved breakpoints are not loaded. However, you can load a breakpoint file using the Action Point menu item in the process window. If you need the definitions in your .tvdrc file, start TotalView first and open MemoryScape from within TotalView.
Red Zones
Tells MemoryScape to set the Red Zones option on or off for the selected processes.


