Manage Processes and Files
Use the controls within this screen to control process execution. Unlike the controls on the Memory Debugging Session screen, you can individually control process execution.
Move your cursor over the graphic to obtain help.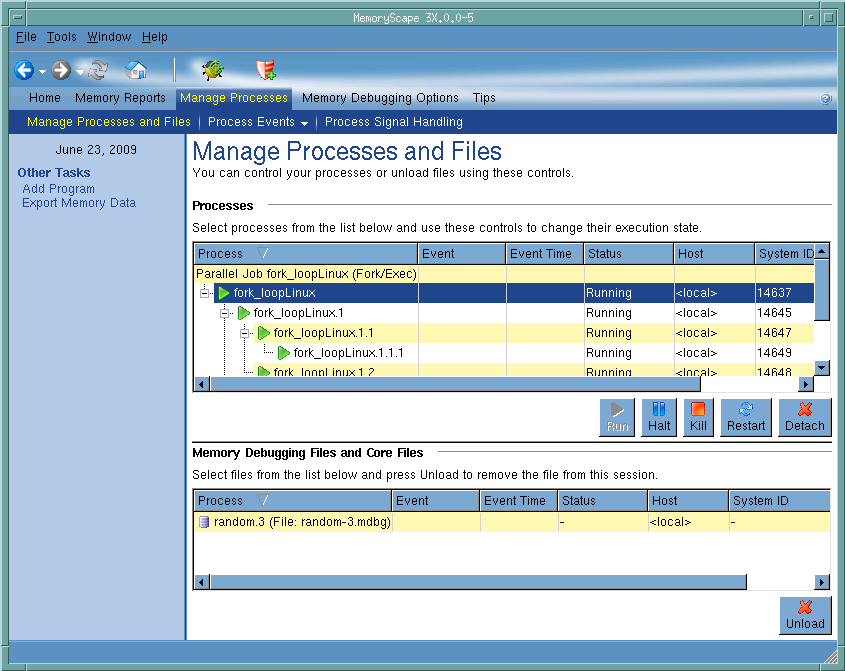
Processes
Displays all processes in the current memory session. The execution controls below this area are applied to the current selection. That is, you can select one or more processes and then either halt or run just these processes.
Execution controls
These controls let you run or halt a process, kill or restart your program, or detach (remove) a program that was previously running from this memory debugging session.
Memory Debugging Files and Core Files
Select a memory debugging file so that it can be unloaded (removed) from MemoryScape.
Unload
Click this button to remove the selected memory debugging file from the MemoryScape session.
Debug in TotalView
Tells MemoryScape to open the currently selected process in TotalView. The TotalView process window will display the current state of that process. You must have a TotalView license available to debug in TotalView.
Be aware that opening the TotalView process window from within MemoryScape does not initialize TotalView in the same way as starting TotalView directly. The definitions in your .tvdrc file and your saved breakpoints are not loaded. However, you can load a breakpoint file using the Action Point menu item in the process window. If you need the definitions in your .tvdrc file, start TotalView first and open MemoryScape from within TotalView.
Red Zones
Tells MemoryScape to set the Red Zones option on or off for the selected processes.


