Leak Detection Backtrace Report
Use this report to organize leak information by the backtraces (call stacks) associated with a function when your program created the memory block.
For more information, see “Task 9: Seeing Leaks.”
Move your cursor over the graphic to obtain help.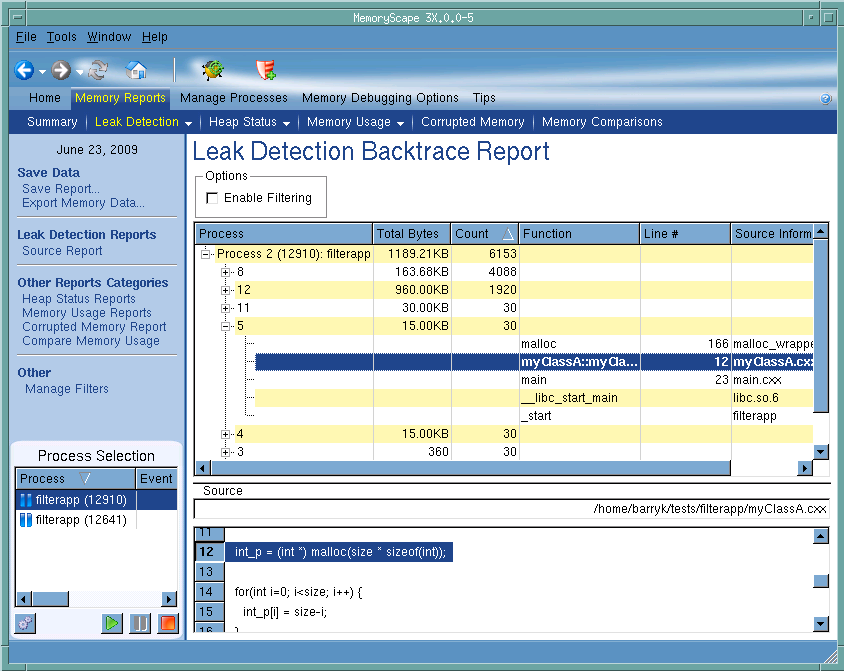
Process Selection
Contains a list of processes and files added to this memory debugging session.
Execution controls
These controls let you refresh or create ( ) this report, run (
 ), or halt (
 ) your program.
), or halt () your program.Options
Click the Enable Filtering check box to tell MemoryScape to apply your filter against the leak display. This action excludes information from the report.
Backtrace area
Groups all of your programs leak by the backtrace ID created by MemoryScape when it allocated the block. A backtrace is the call stack that existed when your program allocated the memory block.
Source file area
Names the source file in which the selected item resides. This may not apply to all selections.
Source code area
Shows the line in your program associated with the information shown in the backtrace area. When you click on a function in the backtrace area, the information in this area changes.
The place where your program allocates memory can be associated with more than one backtrace. Assume that a function is called from five different places in your program. If each calls the allocation function, there would be five different backtraces even though only one statement actually allocates the memory. By organizing information by backtrace, you can gain a better understanding of the path your program takes as it allocates memory.
Debug in TotalView
Tells MemoryScape to open the currently selected process in TotalView. The TotalView process window will display the current state of that process. You must have a TotalView license available to debug in TotalView.
Be aware that opening the TotalView process window from within MemoryScape does not initialize TotalView in the same way as starting TotalView directly. The definitions in your .tvdrc file and your saved breakpoints are not loaded. However, you can load a breakpoint file using the Action Point menu item in the process window. If you need the definitions in your .tvdrc file, start TotalView first and open MemoryScape from within TotalView.
Red Zones
Tells MemoryScape to set the Red Zones option on or off for the selected processes.


