File > Preferences (Memory Debugging)
Use this dialog box to set MemoryScape preferences.
Move your cursor over the graphic to obtain help.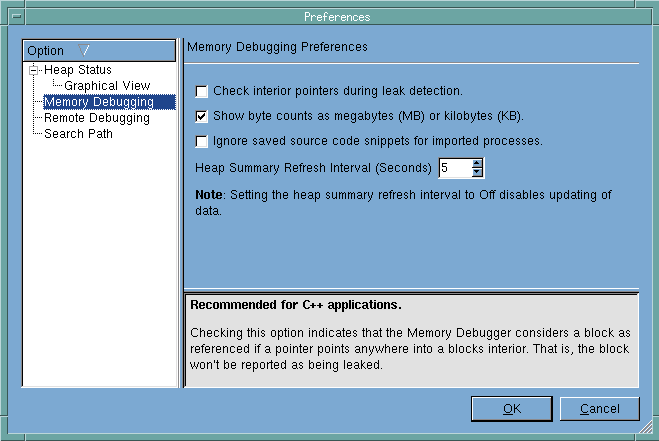
Option
Selecting an option lets you change which preference you can set.
Check interior pointers during leak detection
When enabled, MemoryScape also checks to see if a pointer is pointing into the middle of a block instead of just to the beginning of a block. This will decrease the number of reported leaks. However, MemoryScape will need more time to perform its checks.
Some C++ compilers may allocate additional space at the beginning of an allocated block when you use the new statement. In these cases, you should enable this option.
Show byte counts as megabytes (MB) or kilobytes (KB)
When enabled, MemoryScape displays memory blocks in megabytes instead of kilobytes.
Ignore saved course code snippets for imported processes
When enabled, MemoryScape does not read in the source code that it saves around allocations. This can greatly speed up how fast MemoryScape reads in a file and does save some memory. However, you do loose some capabilities.
Heap Summary Refresh Interval (Seconds)
Tells MemoryScape how often it should stop your program to gather the information it needs to refresh the Heap Summary graph. If you set this value to 0, MemoryScape will not update the graph.
Help area
MemoryScape displays information about the control that you are about to select.


