UPC Programs
TotalView supports debugging UPC programs on Linux x86 platforms. This section discusses only the UPC-specific features of TotalView. It is not an introduction to the UPC Language. For an introduction to the UPC language, see Introduction to Unified Parallel C: A PGAS C.
On this page:
Invoking TotalView
The way in which you invoke TotalView on a UPC program is straight-forward. However, this procedure depends on the parallel technology you are using. Here are a couple of examples:
-
For Quadrics RMS:
totalview prun -a
prog_upc_args -
For MPICH and LAM:
totalview mpirun -a -np 2
prog_upc_args
Viewing Shared Objects (Classic UI Only)
TotalView displays UPC shared objects, and fetches data from the UPC thread with which it has an affinity. For example, TotalView always fetches shared scalar variables from thread 0.
The upper-left screen in Figure 106 displays elements of a large shared array. You can manipulate and examine shared arrays the same as any other array. For example, you can slice, filter, obtain statistical information, and so on. The lower-right screen shows a slice of this array.
Figure 106. A Sliced UPC Array
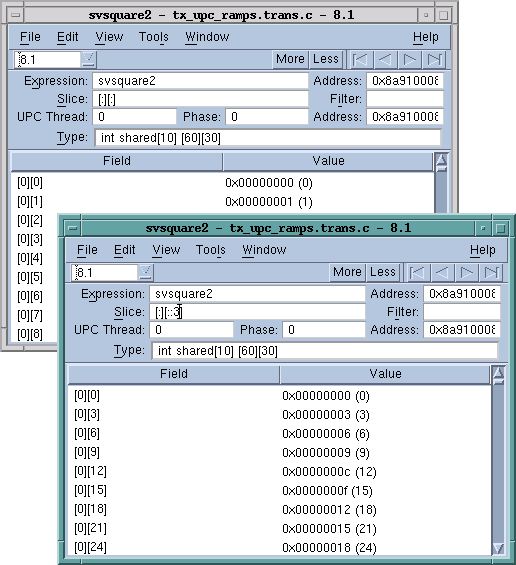
In this figure, TotalView displays the value of a pointer-to-shared variable whose target is the array in the Shared Address area. As usual, the address in the process appears in the top left of the display.
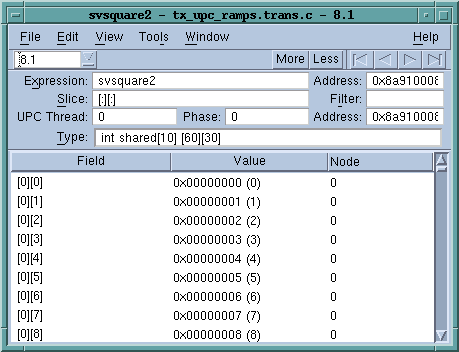
Since the array is shared, it has an additional property: the element’s affinity. You can display this information if you right-click your mouse on the header and tell TotalView to display Nodes.
Figure 107. UPC Variable Window Showing Nodes
You can also use the Tools > Visualize Distribution command to visualize this array. For more information on visualization, see “Array Visualizer” in the Classic UI documentation.
Displaying Pointer to Shared Variables (Classic UI Only)
TotalView understands pointer-to-shared data and displays the components of the data, as well as the target of the pointer to shared variables. For example, Figure 108 shows this data being displayed.
Figure 108. A Pointer to a Shared Variable
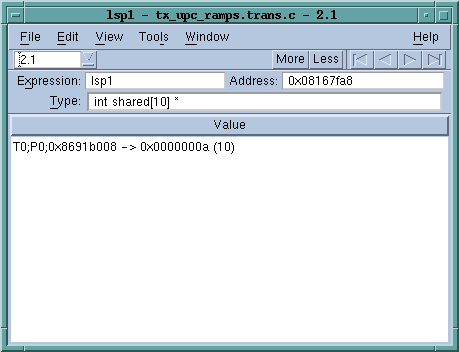
In this figure, note the following:
-
Because the Type field displays the full type name, this is a pointer to a shared int with a block size of 10.
-
TotalView also displays the upc_threadof ("T0"), the upc_phaseof ("P0"), and the upc_addrfield (0x0x10010ec4) components of this variable.
In the same way that TotalView normally shows the target of a pointer variable, it also shows the target of a UPC pointer variable. When dereferencing a UPC pointer, TotalView fetches the target of the pointer from the UPC thread with which the pointer has affinity.
You can update the pointer by selecting the pointer value and editing the thread, phase, or address values. If the phase is corrupt, you’ll see something like the following in the Value area:
T0;P6;0x3ffc0003b00 <Bad phase [max 4]> ->
0xc0003c80 (-1073726336)
In this example, the pointer is invalid because the phase is outside the legal range. TotalView displays a similar message if the thread is invalid.
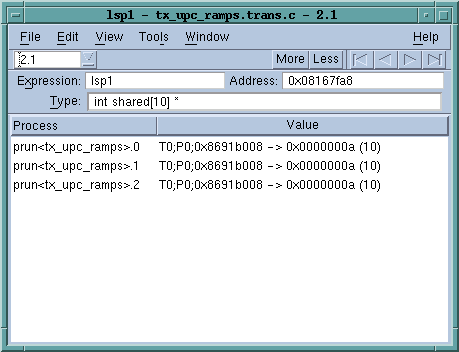
Since the pointer itself is not shared, you can use the TView > Show Across commands to display the value from each of the UPC threads.
Figure 109. Pointer to a Shared Variable