Starting TotalView and Creating a Debugging Session
On this page:
Start TotalView in two primary ways: with no arguments to launch the Start Page, or with arguments to skip the Start Page and open the UI with the program loaded and ready to debug.
The Start Page
If you start TotalView without arguments, the UI displays the Start Page, from which you can access the Sessions Editor. This is the easiest way to load a program into TotalView. Once you configure a debugging session using the Sessions Editor, the settings are saved under Recent Sessions so you can access them later.
Figure 1.Starting TotalView at the Start Page
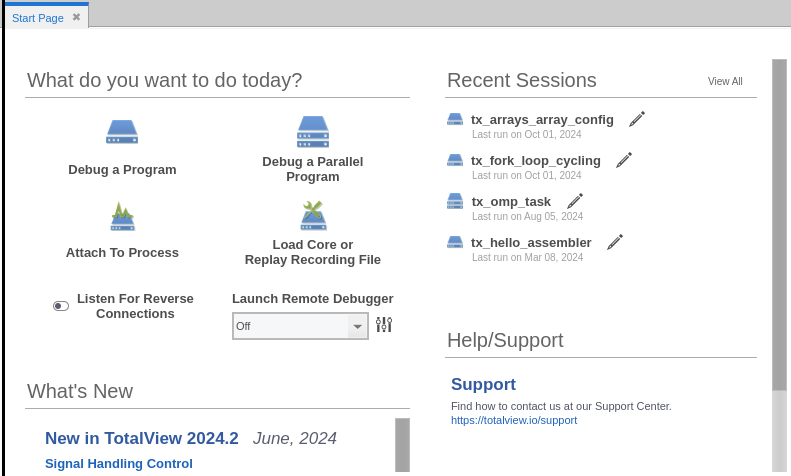
From this page you can:
-
Specify a program to debug — Debug a Program
-
Specify a parallel program to debug — Debug a Parallel Program
-
Start debugging a running program — Attach to Process
-
Specify a core file to debug or a ReplayEngine recording file to load — Load Core or Replay Recording File
-
Restart a previously defined session — example: tx_arrays_array_config
-
Run the TotalView UI on a local machine while accessing the TotalView engine on a remote node — Listen for Reverse Connections
-
Remotely debug a program — Launch Remote Debugger
-
Open the support web page — Support
Loading a program directly into TotalView
Load a program into TotalView by entering:
totalview executable_name [ argument argument ... ]
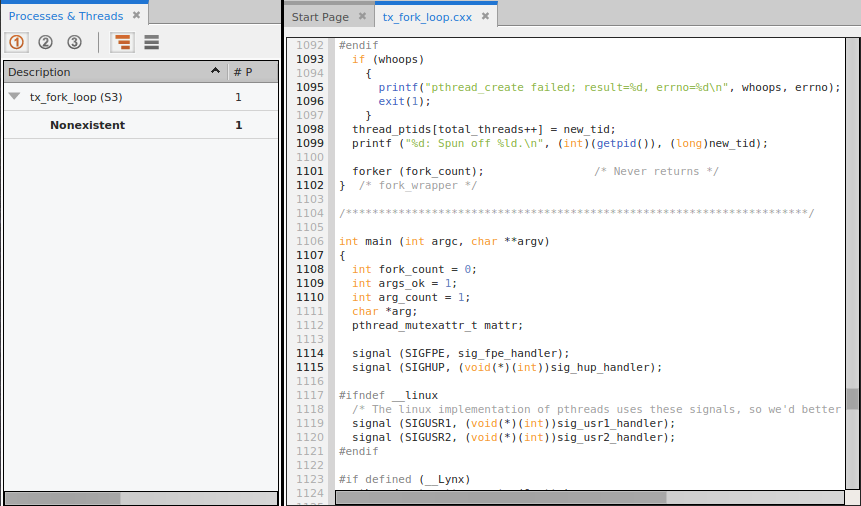
where executable_name is the executable of the program you want to debug, followed by any arguments the program takes. This opens the TotalView UI with the program loaded and ready to debug.
Figure 2 shows the Source view for the program and the Processes & Threads view. These are just two of several available views.
Figure 2. Starting TotalView with an executable name
|
Defining, Editing, and Managing Sessions |
|
|
More on compiling programs for debugging |
|
|
More on starting TotalView |