Native Python debugging limitations
The following features and workflow differences apply to native Python debugging.
On this page:
Unsupported features
The following TotalView features are not available when debugging native Python programs:
-
Reverse debugging
-
Memory debugging
-
Array view and charting
-
Freezing and floating data
-
Viewing data across a set of threads or processes
-
Reverse connect
-
Attaching to a running Python program
Differences from compiled-language debugging
Workflow differences
-
You can launch single-process Python programs from the command line or the Session Editor. To launch a parallel Python program, use an MPI launcher from the command line; the Session Editor does not support launching parallel Python programs.
-
After launch, most debugging workflows can be performed using the user interface.
Data differences
-
Memory addresses are not displayed.
-
Data structures are shown using Python-native representations.
-
Some data display features available for C/C++ are not available.
Known issues and workarounds
The following known issues apply to native Python debugging:
Wrapper file behavior
During program startup, execution may stop in intermediate wrapper files before reaching your Python source code. Click Go ( ) to continue execution until your Python code is reached, or set breakpoints in your Python files before running.
Processes blocked in system calls
A Python process that is blocked in a library call cannot be stopped by the debugger until the call returns to the Python code. Examples include time.sleep() and MPI operations such as mpi4py.COMM_WORLD.Barrier().
If you attempt to stop a Python process that is blocked in a library call (for example, by selecting Process > Halt), the process appears in the “Mixed” state, as shown below. The Mixed state indicates that TotalView has requested the process to stop, but the stop remains pending because the process is blocked in a library call. The process will stop once the library call returns to the Python code.
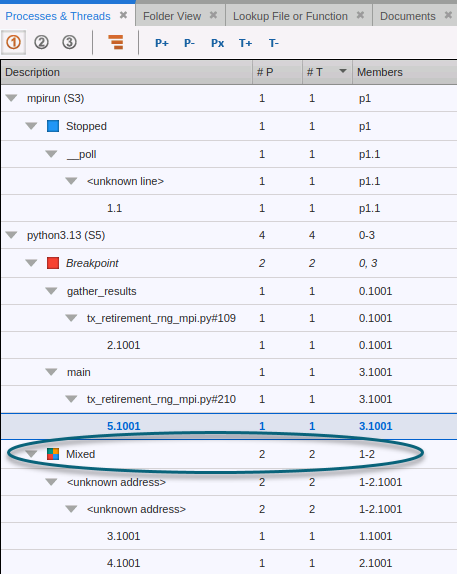
A common example occurs in an MPI job when one process stops at a breakpoint while another process is blocked in a library call waiting for it. The blocked process cannot return until the stopped process resumes and satisfies the wait condition, such as an MPI barrier. After a halt, the blocked process will remain in the Mixed state until the blocking library call returns.
When you focus a process in the Mixed state, the related views show the following:
-
Call Stack view: Shows the frames where each thread of the process is blocked. If TotalView cannot read the stack, the view shows the message "Failed to get a valid stack trace".
-
Local Variables view: Shows the message "Thread has not stopped". TotalView can read the stack of a blocked thread, but it cannot read variable values until the thread stops.
-
Data View: A variable that you add while the process is Mixed shows the value
<Thread has not stopped>. The value appears after the thread stops.
When variables cannot be shown for other reasons, the Local Variables view shows a message that describes the reason, such as "Thread no longer exists", "No stack available", "Frame no longer available", "No symbol information for frame", or "Cannot look up variables for frame".
Local Variables view shows "No Arguments or Locals" for a stopped process
In some cases, a process appears as Stopped, but the Local Variables view shows "No Arguments or Locals" even though the frame has variables, and the Data View shows <Thread has not stopped>. This occurs when a halt that was pending while the process was blocked (see Processes blocked in system calls) stops a thread other than the main thread. The process is reported as Stopped, but the main thread has not been suspended.