Option: Guarding Allocated Memory
On this page:
When your program allocates a memory block, any data written outside of the block results in data corruption.
To quickly identify instances in which your program may be incorrectly writing data either before or after a block, use guard blocks. Guard blocks are small blocks of additional memory created just before and after an allocated block. At initialization, TotalView writes a bit pattern into these guard blocks so you can quickly see if they are overwritten or corrupted via a memory event report or event notification.
Enabling and configuring guard blocks
Enable allocated memory blocks from either the Program Session page in the Session Editor or from the Debug menu after your debugging session has started.
Figure 198. Guard allocated memory configuration
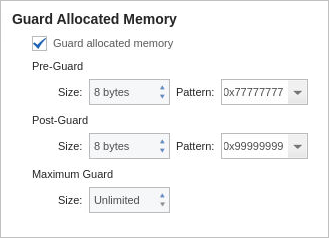
Pre-Guard:
The size of the pre-guard block and its pattern. The default is 0x77777777.
By default, each guard block uses 8 bytes of memory.
Post-Guard:
The size of the post-guard block and its pattern. The default is 0x99999999.
Maximum Guard:
The maximum size for the guard blocks. Because different operating systems align information differently, setting a maximum size here can ensure that blocks don’t use an excessive amount of memory, if memory is tight.
The default is 0, in which no maximum size is set.
Example: Viewing a guard corruption event report
You can view corrupted guard blocks in your program in two ways:
The guard corruption event report discussed in this section. This is a memory event generated when a specific corrupted block of memory is deleted.
The Corrupt Guard Block Report, which lists all known blocks of memory with corrupted guard blocks. See Corrupt Guard Block Reports for detail.
When guard blocks are enabled, you’ll want to choose to generate a memory event report by selecting Debug > Stop on Memory Events from the menu (see Memory Event Reports) for the types of memory events that produce an event report.
If your program has overwritten memory and guard blocks are enabled, TotalView generates an event report when the memory is deleted, for example:
Figure 199. Memory Event Report on guard corruption
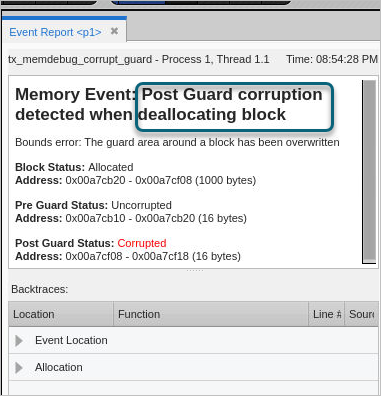
In this case, TotalView has identified a corrupt post-guard block at memory deallocation, with the following information:
Block Status:
The current status of this block is “allocated” at 1,000 bytes.
Pre Guard Status:
The previous status was uncorrupted, at 16 bytes.
Post Guard status:
The status is now corrupted, as it has been allocated with 1,000 bytes, overwriting the 16 bytes it previously had and corrupting memory outside of its allocation.
To find more information about this piece of memory, drill down into the Backtraces pane at the bottom of the event report:
Figure 200. Guard corruption event report, backtrace, deallocation event
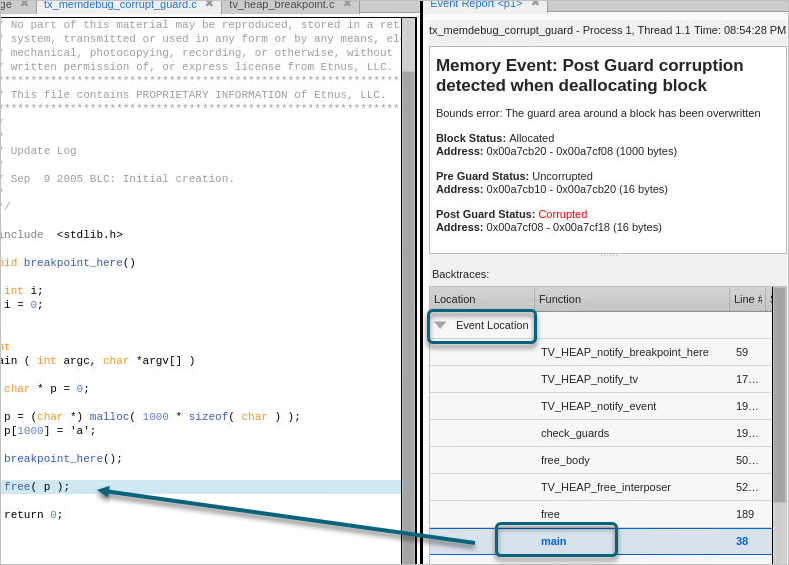
The Event Location dropdown in the Backtraces pane highlights the location of the deallocation, which occurred in main(). When selected, the focus in the Source view changes to the line where deallocation occurred.
To see the allocated block, drill down under Allocation in the Backtraces pane.
Figure 201. Guard corruption event report, backtrace, allocation event
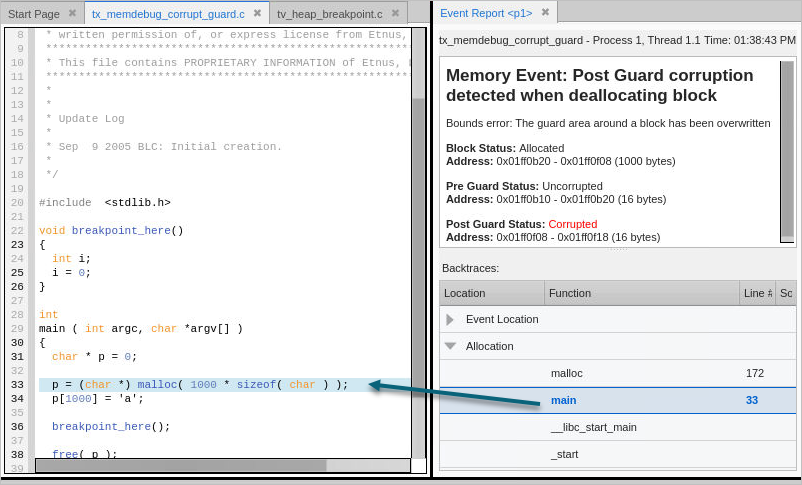
Here, note that the 1,000 bytes allocated in main, line 33, were subsequently overwritten, resulting in a corrupt guard.
Because you now know which block was corrupted, you can begin to locate where the overwrite occurred. In many cases, you will rerun your program, focusing on those blocks.