View and update local variables
In the Local Variables view, you can inspect variable values when debugging a stopped thread. This information can help you verify the program state and troubleshoot issues.
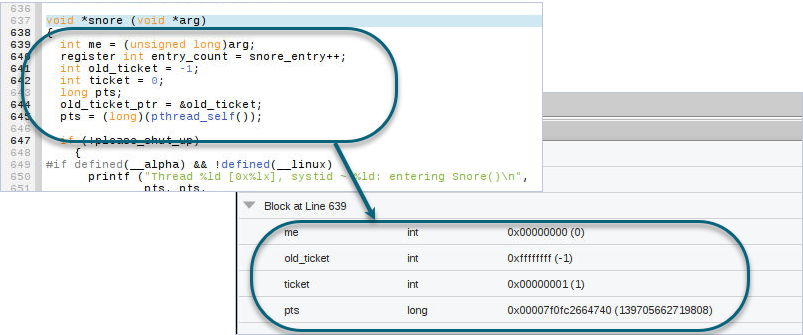
The Local Variables view displays all arguments and local variables associated with the selected frame in the Call Stack view at the moment when the thread stopped. For example, in Figure 35, for the selected function snore, the Local Variables view displays the local variables under the associated scope, also known as the program block.
Figure 35. Local variables displayed for an associated program block
Global variables aren't displayed in the Local Variables view. To view global variables, add them to the Data View. See Entering a New Expression into the Data View.
On this page:
View information in tooltips
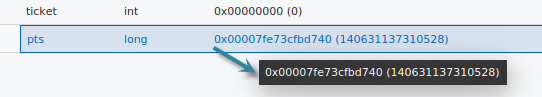
Tooltips are a convenient method for checking variable values and identifying code blocks.
To display a variable's value in a tooltip, hover over the variable.
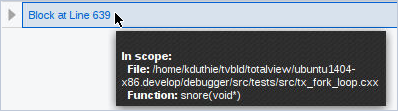
To display a block's file and function in a tooltip, hover over the block.
Show or hide columns
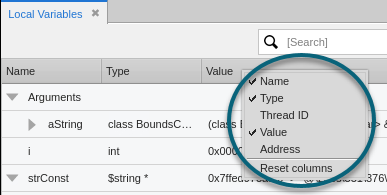
The Local Variables view displays each variable’s name, type, and value by default, but you can also display columns showing the variable's thread ID and address.
To show or hide a column, right-click a column header, and then click the column name.
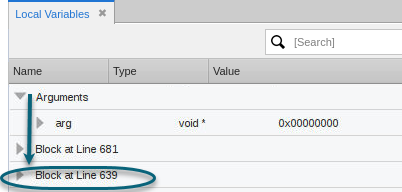
Expand or collapse variables in a block
You can expand a block to inspect its local variables during debugging and to verify how data changes within a specific scope. You can also collapse blocks to keep the list organized and reduce clutter.
-
To expand the list of variables in a block, click the right arrow button
 next to the block.
 -
To collapse the list, click the down arrow button
 .
.
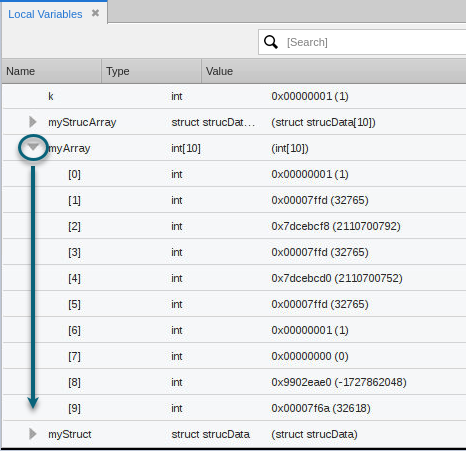
Expand or collapse complex variable structures
You can expand a complex variable structure to inspect its substructures during debugging and to verify detailed data within nested elements. You can also collapse variable structures to keep the list organized and reduce clutter.
-
To expand the list of substructures in a complex variable, click the right arrow button
next to the variable. -
To collapse the list, click the down arrow button
.
You can also dive into a complex variable after you add it to the Data View. See Entering a New Expression into the Data View.
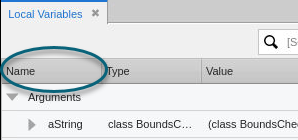
Sort variables by name
By default, variables appear in the view in their natural index order, also known as unordered. However, you can sort the variables alphabetically by name in ascending or descending order.
To change the sort order of the variables list, click the Name column header to cycle through default, ascending, and descending order.
The column header reflects the selected sort order as follows:
 : Unordered.
 : Ascending.
 : Descending.
Filter variables by name
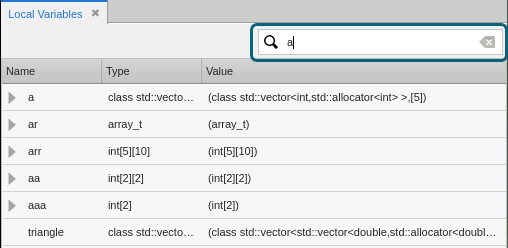
When you are debugging functions with many local variables, you can filter the variable list to locate variables of interest and reduce visual clutter. You can filter the variables list by entering a full or partial variable name, which is especially useful when variables share common prefixes or naming patterns.
To filter the variables list, click in the Search field and enter one or more consecutive characters from the variable name. The list updates as you type and displays only matching variables.
To clear the filter, click the delete button  .
.
If you have previously expanded a top-level variable, filtering also displays any matching child items, even if the top-level variable itself does not match the filter.
Change a variable's value
If you see unexpected values in your data, you can change a variable’s value to test a fix. The new value changes the source code for that session only.
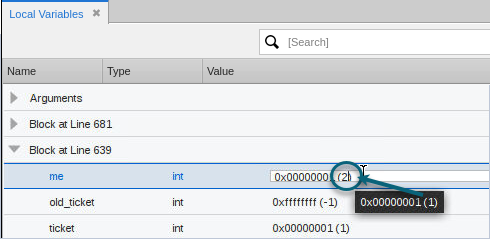
To change a variable’s value, in the Value column, double-click the value and enter a new one.
For example, the following edit changes the value of me from 1 to 2:
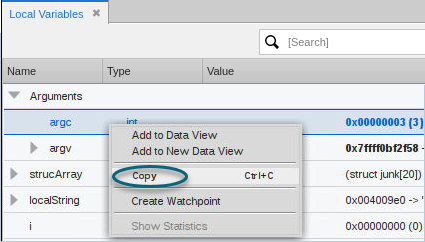
Copy a variable's definition
You can copy a variable's definition to preserve or share key data—like values and types—outside TotalView. The copied definition is useful for documentation, collaboration, and comparing program states during debugging. When you copy a variable definition in the Local Variables view, TotalView copies the variable as a tab-separated string so that pasting it into another program results in columns of data delineated by tabs.
To copy a variable definition, right-click the variable and click Copy.